

Summary
Bitcoin Analysis
On Wednesday when BTC traders settled-up at 12:00 UTC, BTC’s price had narrowly escaped a bearish engulfing candle on the monthly timescale. Despite the poor performance for the month, BTC’s price has managed two green daily sessions out of the last three and concluded Wednesday +$246.00.
The first chart we’re providing analysis for today is from Dejavu787 and it’s the BTC/USD 1D chart. BTC’s price is trading between the 0 [$17,627.77] fibonacci level and 0.382 [$37,317.55] fib level, at the time of writing.
This chart provides a bit of optimism for bullish traders that have seen nearly all of their gains over a two month span erased over the last two weeks. The targets for those still long BTC over the next few months are 0.236 [$29,792.14], 0.382 [$37,317.55], and 0.5 [$43,399.73].
Bearish traders have been flirting with BTC’s 2017 ATH of $19,891 and are trying to re-test 2022’s low [Bitstamp] of [$17,627.77]. Below the $17k level bearish traders could potentially send BTC’s price another 30% lower and down to the low teens which would match the historical retracements for Bitcoin’s price in bear markets.
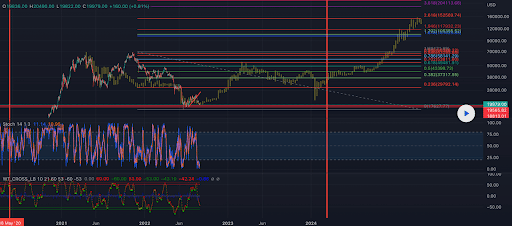
Bitcoin’s Moving Averages: 5-Day [$20,517.83], 20-Day [$22,405.09], 50-Day [$21,838.92], 100-Day [$26,782.27], 200-Day [$35,417.31], Year to Date [$33,032.96].
BTC’s 24 hour price range is $19,812-$20,495 and its 7 day price range is $19,621-$21,744. Bitcoin’s 52 week price range is $17,611-$69,044.
The price of Bitcoin on this date last year was $48,844.
The average price of BTC for the last 30 days is $22,419.4 and its -15.5% over the same duration.
Bitcoin’s price [+1.24%] closed its daily candle worth $20,058 on Wednesday.
Ethereum Analysis
Ether’s price finished Wednesday up greater than 2% and +$31.96.
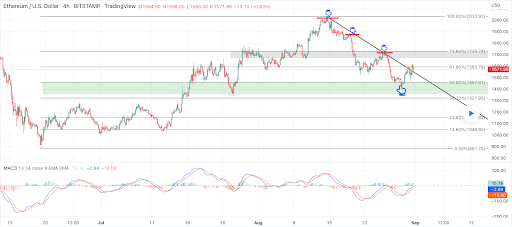
Today’s second chart for analysis is the ETH/USD 4HR chart below by Aki_0123. ETH’s price is trading between the 50.00% fib level [$1,457.81] and 61.80% fib [$1,593.78], at the time of writing.
The overhead targets for bullish traders on the 4HR time frame are 61.80%, 73.60% [$1,729.74], and 100.00% [$2,033.93].
Bearish Ether traders that are short and have been been controlling this market for the last two weeks are 50.00%, 38.20% [$1,321.85], 23.60% [$1,153.62], 14.60% [$1,049.92], and 0.00% [$881.70].
ETH’s 24 hour price range is $1,516-$1,619 and its 7 day price range is $1,433-$1,713. Ether’s 52 week price range is $883.62-$4,878.
Ether’s price on this date last year was $3,835.96.
The average price of ETH for the last 30 days is $1,697.8 and its -10.55% over the same time frame.
Ether’s price [+2.10%] closed its daily candle on Wednesday worth $1,555.18 and in green digits also for the second time over the last three days.
Quant Analysis
Quant’s price was also sent higher for the second time over the last three daily candles and QNT concluded its daily session +$0.84.
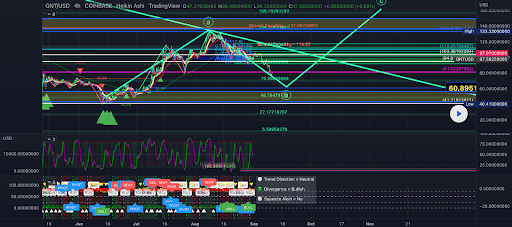
The last chart to wrap-up this Thursday’s price analyses is the QNT/USD 4HR chart below from EMC2PRoPheT.
If bullish QNT traders can reclaim the $100 level and put QNT’s price back into triple digits their primary target is $103.36. The secondary target for bullish QNT market participants is $110.35 with a third target of $132.87.
The downside targets for bearish QNT traders are $94.81, $81.22, $60,89, and $41.21.
Quant’s price is -47.23% against The U.S. Dollar for the last 12 months, +24.75% against BTC, and +15.8% against ETH, over the same timespan.
Quant’s 24 hour price range is $95.35-$100.73 and its 7 day price range is $93.14-$111.21. QNT’s 52 week price range is $40.5-$416.6.
Quant’s price on this date last year was $187.76.
The average price of QNT over the last 30 days is $110.00 and its -8.73% over the same period.
Quant’s price [+0.88%] closed its daily session on Wednesday worth $96.47.