


Summary
Bitcoin analysis
Bitcoin’s price broke back into green figures on Sunday and when traders settled-up at the daily session’s close, BTC’s price was +$14.7.
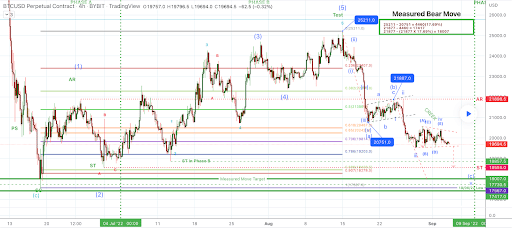
The first chart we’re looking at today is the BTC/USD 4HR chart below from zippy1day. BTC’s price is trading between the 0.706 fibonacci level [$19,814.5] and the 0.65 fib level [$20,242.5] at the time of writing.
The primary overhead target for bullish traders is 0.65 with a secondary target of 0.618 [$20,487.0]. After the 0.618 bullish BTC market participants have targets of 0.5 [$21,389.0], 0.382 [$22,291.0], and 0.236 [$23,407.0].
Conversely, the targets to the downside of the chart for bearish traders are 0.706, 0.786 [$19,203.0], 0.886 [$18,438.5], 0.907 [$18,278.0], and 1 [$17,567.0].
Bitcoin’s Moving Averages: 5-Day [$20,079.53], 20-Day [$22,135.08], 50-Day [$21,801.08], 100-Day [$26,380.10], 200-Day [$35,053.12], Year to Date [$32,884.62].
BTC’s 24 hour price range is $19,589-$20,039 and its 7 day price range is $19,589-$20,504. Bitcoin’s 52 week price range is $17,611-$69,044.
The price of Bitcoin on this date last year was $51,762.
The average price of BTC for the last 30 days is $22,014.9 and its -13.4% over the same time frame.
Bitcoin’s price [+0.07%] closed its daily candle worth $19,847.8 on Sunday and in green figures for the first time in three days.
Ethereum Analysis
Ethereum market participants are wondering if the upcoming start of the merge is already priced in or whether the event could affect its price still. ETH’s price wrapped up Sunday’s daily session +$21.29.
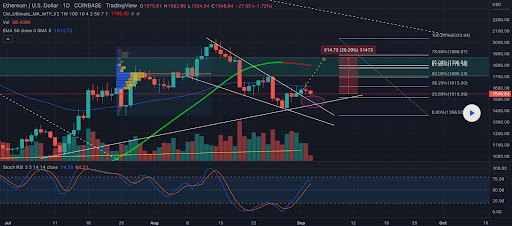
The ETH/USD 1D chart below by EdgarTigranyan is the second chart we’re providing analysis for this Monday. ETH’s price is trading between the 23.60% fib level [$1,516.39] and 38.20% [$1,615.30], at the time of writing.
Above the 38.20% fib level the targets for bullish ETH traders are 50.00% [$1,695.23], 61.80% [$1,775.16], 65.00% [$1,796.84], 78.60% [$1,888.97], and 100.00% [$2,033.94].
Bearish Ether traders that are at variance with bulls are hoping to push ETH’s price back below the 23.60% fib level with a secondary target to the downside of a complete retracement at 0 [$1,356.52].
ETH’s 24 hour price range is $1,540.66-$1,583.66 and its 7 day price range is $1,433.57-$1,639.71. Ether’s 52 week price range is $883.62-$4,878.
The price of ETH on this date in 2021 was $3,950.91.
The average price of ETH for the last 30 days is $1,687.65 and its -3.87% over the same timespan.
Ether’s price [+1.37%] closed its daily candle on Sunday worth $1,578.86 and in green figures for the first time over the last three days.
Cardano Analysis
Cardano’s price also marked-up higher on Sunday and ADA closed its daily session +$0.0232.
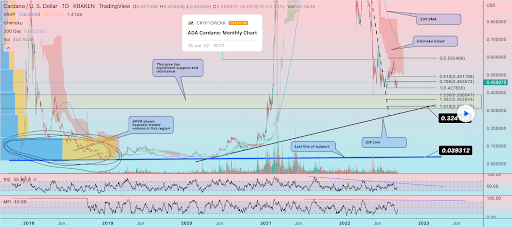
The ADA/USD 1D chart below from CRYPTOPICKK shows the importance of Cardano’s price holding the 0.618 fib level [$0.491] in the interim if bullish ADA traders want to see higher prices.
Above the 0.618 the next target for bullish market participants of ADA is the 0 fib level $0.595.
The bearish perspective is one where bearish traders want to again push ADA’s price back below the $0.5 level and then below the 0.618. Below that level the targets to the downside on ADA are 0.786 [$0.463], 1 [$0.427], 1.236 [$0.388], 1.382 [$0.363], and 1.618 [$0.328].
Cardano’s 24 hour price range is $0.475-$0.51 and its 7 day price range is $0.428-$0.51. ADA’s 52 week price range is $0.403-$2.95.
Cardano’s price on this date last year was $2.91.
The average price of ADA over the last 30 days is $0.492 and its +0.362% over the same duration.
Cardano’s price [+4.83%] closed its session on Sunday worth $0.5 and in green digits for a second straight day.