Summary
Bitcoin Analysis
Bitcoin’s price was finally sent well below its 2017 all-time high of $19,891 on Tuesday and when the day’s session had concluded, BTC’s price had bearishly engulfed its daily candle and was -$1,004.
The first chart we’re looking at this Tuesday is the BTC/USD 1D chart below by ICE-Forex. BTC’s price is trading between the 0 fibonacci level [$18,718.9] and 0.236 [$20,114.1], at the time of writing.
The overhead targets for bullish traders if they can somehow disrespect what the technicals are suggesting are, 0.236, 0.382 [$20,977.2], 0.5 [$21,674.9], 0.618 [$22,372.5], and 0.786 [$23,365.7].
Bearish BTC traders on the other hand are looking to push BTC’s price below the 0 fib level [$18,718.9] with an eventual target of a retest of BTC’s 12-month low of $17,611.


Bitcoin’s Moving Averages: 5-Day [$19,964.91], 20-Day [$21,753.38], 50-Day [$21,769.38], 100-Day [$25,956.29], 200-Day [$34,673.88], Year to Date [$32,736.66].
BTC’s 24 hour price range is $18,649-$20,180 and its 7 day price range is $18,649-$20,392. Bitcoin’s 52 week price range is $17,611-$69,044.
The price of Bitcoin on this date last year was $46,778.
The average price of BTC for the last 30 days is $21,841.8 and its -12.4% over the same time frame.
Bitcoin’s price [-5.09%] closed its daily candle worth $18,786.1 on Tuesday and in red figures for the fourth time over the last five days.
Ethereum Analysis
Ether’s price didn’t trade as poorly by percentage as BTC’s price on Tuesday but still marked down considerably [-$59.65] for its daily session.
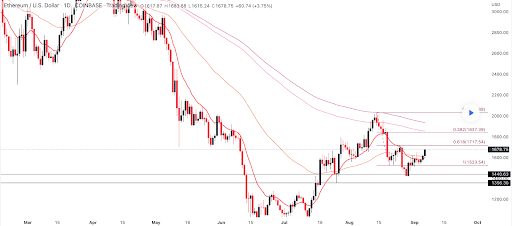
Today’s second chart for analysis is the ETH/USD 1D chart below by DannyC914. ETH’s price is trading between the 1 fibonacci level [$1,523.54] and 0.618 [$1,717.54], at the time of writing.
The overhead targets of those that remain short-term bullish on Ether are 0.618, 0.382 [$1,837.39], and full retracement at 0 [$2,031.39].
Conversely, bearish traders that are short the ETH market are looking to snap the 1 fib level to the downside with the eventual aim of setting a fresh 12-month low below $883.62.

ETH’s 24 hour price range is $1,555-$1,687.4 and its 7 day price range is $1,522.77-$1,687.4. Ether’s 52 week price range is $883.62-$4,878.
The price of ETH on this date in 2021 was $3,422.38.
The average price of ETH for the last 30 days is $1,689.5 and its +3.19% over the same period.
Ether’s price [-3.69%] closed its daily candle on Tuesday worth $1,557.84 and in red digits for the first time in three days.
Binance Coin Analysis
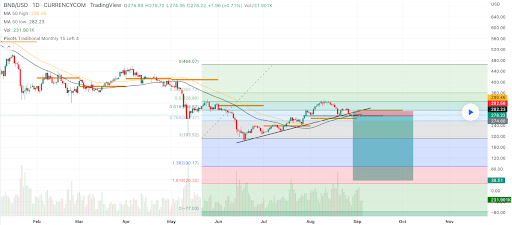
The third chart we’re looking at for this Wednesday is the BNB/USD 1D chart below from Obavic2002. BNB’s price is trading between the 0.764 fib level [$257.37] and 0.618 [$296.87], at the time of writing.
With BNB’s price breaking a long-term trend line on the daily timescale recently it’s going to be a real challenge for bullish traders to reverse course at this level but they do have support at the $257.37 level. Above that level the targets for bullish traders are 0.618, 0.5 [$328.8], 0.382 [$360.72], and 0 [$464.07].
The primary bearish target on BNB is 0.764 with a secondary target of 1 [$193.52]. The targets below the 1 fib level are 1.382 [$90.17], and 1.618 [$26.32].

Binance Coin’s 24 hour price range is $261.5-$286.3 and its 7 day price range is $261.5-$289.4. BNB’s 52 week price range is $184.1-$668.8.
Binance Coin’s price on this date last year was $417.3.
The average price of BNB over the last 30 days is $299.3 and its -10.03% over the same timespan.
Binance Coin’s price [-5.2%] closed its daily session on Tuesday worth $262.3 and in red figures for a second straight day.


