

Summary
Bitcoin Analysis
Bitcoin’s price failed to put in a green daily session over the weekend and when traders settled-up on Sunday, BTC’s price was -$122.2.
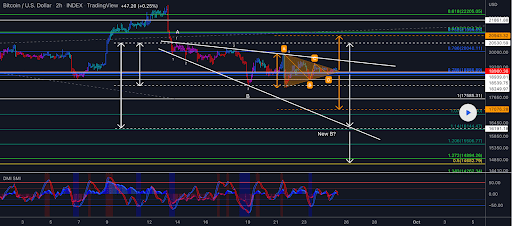
We’re leading the new week off with the BTC/USD 2HR chart below from andre_007 to start our price analyses. BTC’s price is trading between the 1 fibonacci level [$17,585.31] and 0.786 [$20,040.11], at the time of writing.
Bullish traders are hoping they can break out of the current descending broadening wedge pattern that BTC’s price is trading within and bulls have targets to the upside of 0.786, 0.702 [$21,154.7], and 0.618 [$22,205.05].
Conversely, bearish traders are looking to follow-up a successful bearish backtest of BTC’s 2017 ATH [$19,891] with a test of its 2022 low of $17,611. The targets for bearish traders are the 1 fib level followed by 1.07 [$16,879.5], 1.14 [$16,144.47], 1.206 [$15,506.77], 1.272 [$14,894.26 and 1.343 [$14,262.34].
Bitcoin’s Moving Averages: 5-Day [$19,106.06], 20-Day [$19,845.37], 50-Day [$21,636.72], 100-Day [$23,467.92], 200-Day [$32,687.96], Year to Date [$31,849.04].
BTC’s 24 hour price range is $18,629.2-$19,180.2 and its 7 day price range is $18,424.7-$19,721.93. Bitcoin’s 52 week price range is $17,611-$69,044.
The price of Bitcoin on this date last year was $43,180.
The average price of BTC for the last 30 days is $20,005.5 and its -12.5% over the same period.
Bitcoin’s price [-0.65%] closed its daily candle worth $18,802 and in red figures for a third consecutive day on Sunday.
Ethereum Analysis
Ether’s price concluded Sunday’s daily candle -$22.79, as bullish ETH market participants continue to look for solid footing and look to put an end to the sea of red that’s overtaken ETH charts since the beginning of The Merge.
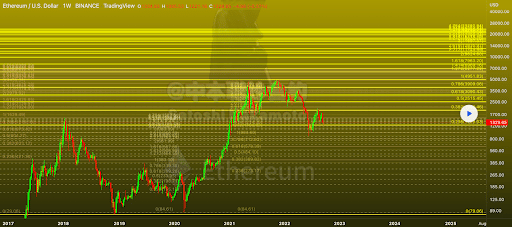
The next chart we’re looking at this Monday is the ETH/USD 1W chart below by ZhongBenCong001. ETH’s price is trading between the 0.236 fib level [$1,229.03] and 0.236 [$1,940.46], at the time of writing.
The targets to the upside on Ether for bullish traders are 0.236, 0.382 [$1,940.46], 0.5 [$2,515.45], 0.618 [$3,090.43], 0.786 [$3,909.86], and 1 [$4,951.83].
At variance with bullish traders are bearish traders and their targets are 0.236 and a full tracement at 0 [$79.06].
ETH’s 24 hour price range is $1,269.27-$1,337 and its 7 day price range is $1,238.84-$1,388.23. Ether’s 52 week price range is $883.62-$4,878.
The price of ETH on this date in 2021 was $3,063.32.
The average price of ETH for the last 30 days is $1,522.53 and its -23.05% over the same duration.
Ether’s price [-1.73%] closed its daily candle on Sunday worth $1,294.21 and in red digits for a second straight daily session.
Dogecoin Analysis
Dogecoin’s price was the worst performer of today’s price analyses and when the day’s candle had closed, DOGE was -$0.00192.
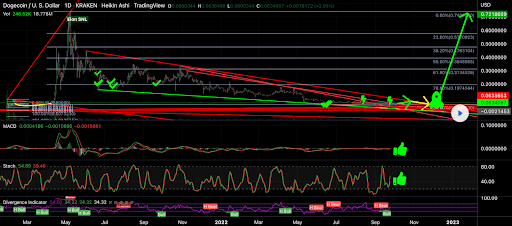
The final chart we’re looking at for Monday is the DOGE/USD 1D chart from davedesigns. Dogecoin’s price is trading between the 100.00% fib level $0.049 and the 78.60% fib level [$0.197], at the time of writing.
Those that are long the DOGE market have a primary aim of 78.60% followed by 61.80% [$0.313], 50.005 [$0.394], 38.20% [$0.763], 23.60% [$0.570], and 0.00% [$0.740].
Bearish traders that are shorting DOGE have a first target of the 100.00% fib level with a goal of making a new 12-month low if successful at the 100.00% fib level.
Dogecoin’s 24 hour price range is $0.060-$0.063 and its 7 day price range is $0.056-$0.067. DOGE’s 52 week price range is $0.049-$0.339.
Dogecoin’s price on this date last year was $0.204.
The average price of DOGE over the last 30 days is $0.061 and its -11.26% over the same timespan.
Dogecoin’s price [-3.04%] closed its daily session on Sunday worth $0.061 and finished in red figures for two straight days.