

Summary
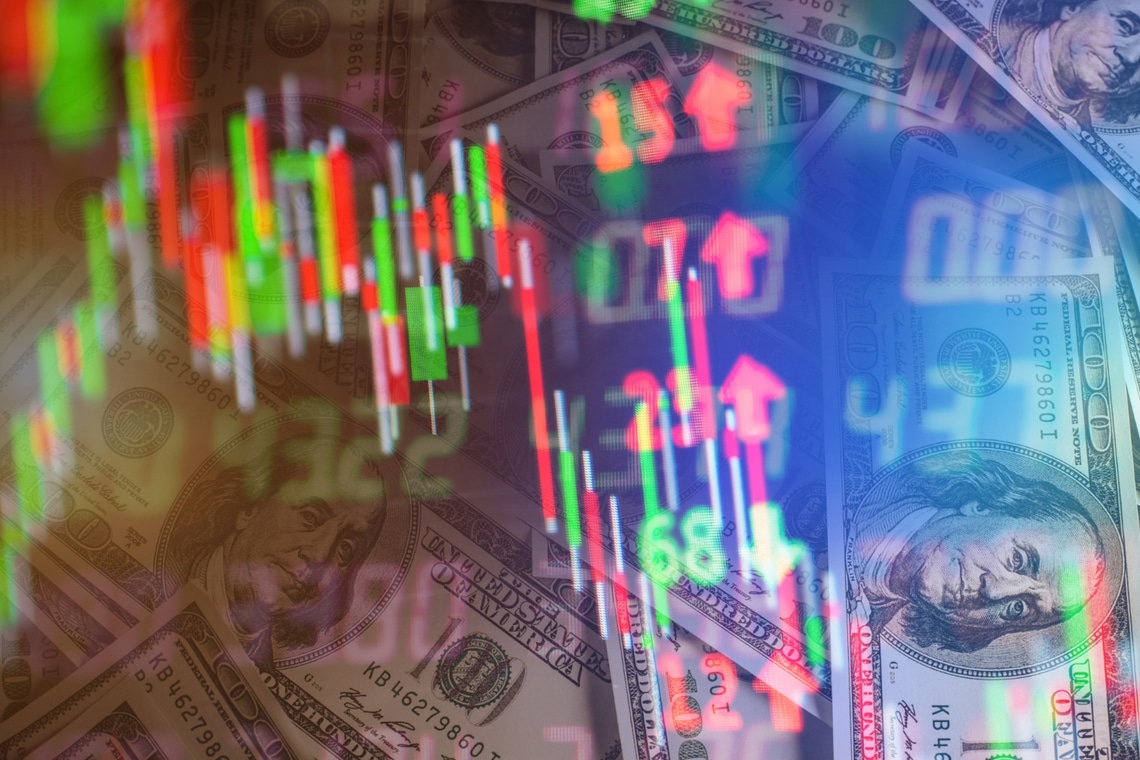
Bitcoin Analysis
The S&P 500 had its lowest close in over 2 years on Monday but BTC’s price closed in positive figures and when traders settled up at its daily session close, BTC’s price was +$422.6.
We’re beginning our price analyses today with the BTC/USD 1D chart below from alhumran. BTC’s price saw a nice rebound on Monday but has yet to regain its 2017 all-time high of $19,891 and is trading between the 1 fibonacci level [$12,272.29] and 0.786 [$19,944.48], at the time of writing.
Overhead targets for bullish traders are 0.786, 0.618 [$25,965.93], 0.5 [$30,195.28], 0.236 [$39,657.56], and 0 [$48,110.27].
Conversely, bearish BTC traders have a primary target to the downside of the 1 fibonacci level which is the last major area of support on the daily time frame before heading back to a four digit price.


Bitcoin’s Moving Averages: 5-Day [$19,002.9], 20-Day [$19,786.73], 50-Day [$21,587.08], 100-Day [$23,347.57], 200-Day [$32,548.04], Year to Date [$31,781.81].
BTC’s 24 hour price range is $18,680.7-$19,319 and its 7 day price range is $18,424.7-$19,721.93. Bitcoin’s 52 week price range is $17,611-$69,044.
The price of Bitcoin on this date last year was $42,169.6.
The average price of BTC for the last 30 days is $19,929.7 and its -10.8% over the same time frame.
Bitcoin’s price [+2.25%] closed its daily candle worth $19,225.4 and in green figures for the first time in four days on Monday.
Ethereum Analysis
Ether’s price also appreciated on Monday and when the day’s candle closed, ETH’s price was +$42.8.
Today we’re examining Ether’s price per usual and the ETH/USD 1D chart below from CrashWhen. Ether’s price is trading back above its 200W MA [$1,278], at the time of writing.
If bullish ETH market participants can regain the $1,400 level then they may enjoy more short-term success. If bears are able to deny them access to that level and again send ETH’s price below its 200W MA, then the next targets are the 1 fib level [$1,251.9] and 0.618 [$1,211.17].

ETH’s 24 hour price range is $1,277.85-$1,340.42 and its 7 day price range is $1,238.84-$1,381.11. Ether’s 52 week price range is $883.62-$4,878.
The price of ETH on this date in 2021 was $2,926.02.
The average price of ETH for the last 30 days is $1,512.66 and its -20.43 over the same period.
Ether’s price [+3.31%] closed its daily candle on Monday worth $1,337.01 and in green digits for the first time since last Friday.
Solana Analysis
Solana’s price was the top performer of today’s lot and concluded its daily session +$1.57.
The third chart we’re looking at for this Tuesday is the SOL/USD 4HR chart below by maikisch. We can see Solana’s price broke out of its uptrend in mid-August and since has been trying to hold the $30 level.
Bullish traders are trying to regain the 0.236 fibonacci level [$34.34] with a secondary aim of 0.382 [$37.03]. The next targets for bulls are 0.5 [$39.21], 0.618 [$41.38], and 0.786 [$44.47].
If bullish traders fail to regain the 0.236 fib level they risk a trip back down into the $20-$30 range. Bulls should have strong support at the 0.786 with a secondary support level below that at $20.68.

Solana’s Moving Averages: 5–Day [$32.20], 20-Day [$32.74], 50-Day [$37.05], 100-Day [$38.79], 200-Day [$75.81], Year to Date [$70.84].
Solana’s 24 hour price range is $31.87-$33.95 and its 7 day price range is $30.56-$34.5. SOL’s 52 week price range is $25.97-$259.8.
Solana’s price on this date last year was $136.36.
The average price of SOL over the last 30 days is $32.68 and its -5.35% over the same duration.
Solana’s price [+4.86%] closed its daily session on Monday worth $33.89 and back in green figures for the first time in three days.

