
Following Powell’s appearance, which sculpts like a craftsman an increasingly Hawkish Fed without leaving any doubt, we should expect markets to continue to fall as long as the restrictive policy continues and the curve (US10Y – US02Y) does not turn positive again. Like in 2012 with Draghi, Powell is trying to save the Fed, in this case credibility, against an unexpectedly (if we could call it that) strong enemy like inflation that has been underestimated in the previous months, delayed to “fight back.”
Summary
The market does not like what it has been hearing since the beginning of the year
Macroeconomic tensions continue to “weigh” on global markets, combined with those in the crypto world such as Algorand, which announced that it has a $35 million USDC exposure (less than 3% of its assets) in Holdnaut. The foundation said that with the help of laywers, it is working on recovering its funds. As a reminder, Hodlnaut was one of the companies most affected by the Terra Luna crash, leading it to suspend withdrawals since 8 August, having $317 million in UST. In addition, Terra’s co-founder Do Kwon received Red Notice from Interpol and from South Korean prosecutors to attempt to intercept him (locate and provisionally arrest pending extradition), continued to be active on social media despite the potential risk.
Equally important news is that after Ethereum‘s move to Proof-of-Stake (PoS), the Securities Exchange Commission (SEC) declared that transactions fall under the jurisdiction of the US government because of the majority of nodes operated in the country. The latter is not entirely wrong; in fact, 42.5% of the 7807 Ethereum nodes are currently located in the United States. This brings further shadows on crypto and in particular the decentralization of ETH, “hurting” the network and bringing out what many do not see as something possible: the centralization of the network.
For these reasons, and because of the current climate, investors remain cautious and if they lose money in the meantime (due to wrong valuations) they start blaming others for their mistakes: “if it weren’t for the Fed or the Central Banks…”, “if the war hadn’t started or Europe had acted immediately…”, “if futures didn’t influence price action…” etc.
With “ifs” we get nowhere
We must always have the macro context in mind, the stories we want to believe or hope come true do not determine price action. The flow of money does.
Starting with the S&P 500 since the beginning of the year, it is down more than 22% while the Nasdaq more than 30% and Tech stocks, which were the best-performing stocks in recent years, have reversed the trend. FAANG stocks, with the exception (at the moment) of Apple are facing their deepest decline in the last decade followed closely by crypto. In fact, the correlations have been positive for months, with Bitcoin since the beginning of the year having lost about 60% while since the all-time high about 70% of its value.
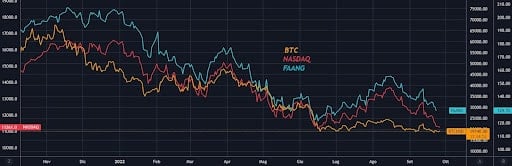
Graphically we can immediately see a lot of weakness, with new lows following, suggesting further downward pressure for risky assets. This at least as long as the dollar (USD) continues to be a safe haven, in fact whenever the latter has gone down we have seen favorable winds for equities and the crypto world, and vice versa.
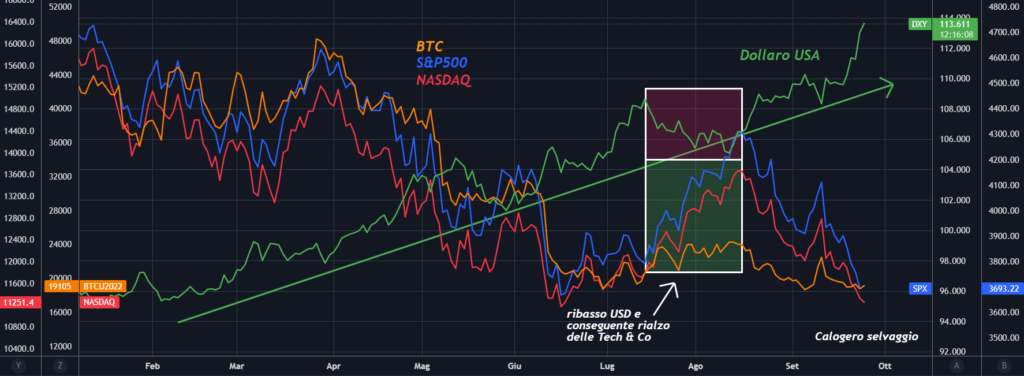
In this case, looking at the chart, the correlation with the dollar is negative (inverse) confirming our thesis and highlighting an additional correlation that is weighing on these assets: that with the VIX and VXN, which is also inverse.
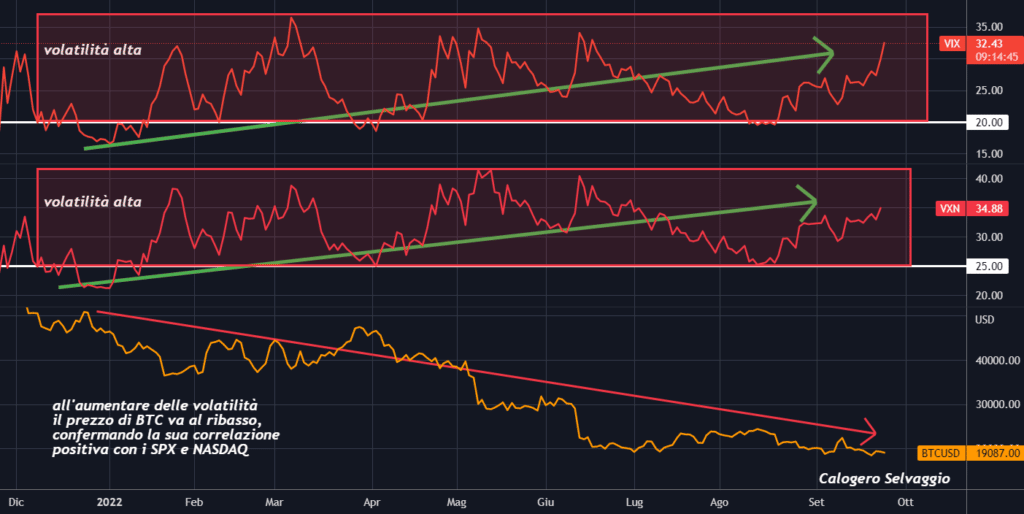
This year has been very volatile, as the chart above shows, this has set up a climate of fear for many investors trying to figure out what the peak was through the fear indexes and the end of the bear market. Meanwhile, the S&P 500 has fallen between 1% and 2% 29 times in 2022 but the VIX has not risen above 40 which historically is an early sign of an upward reversal (as in 2008 and 2020).
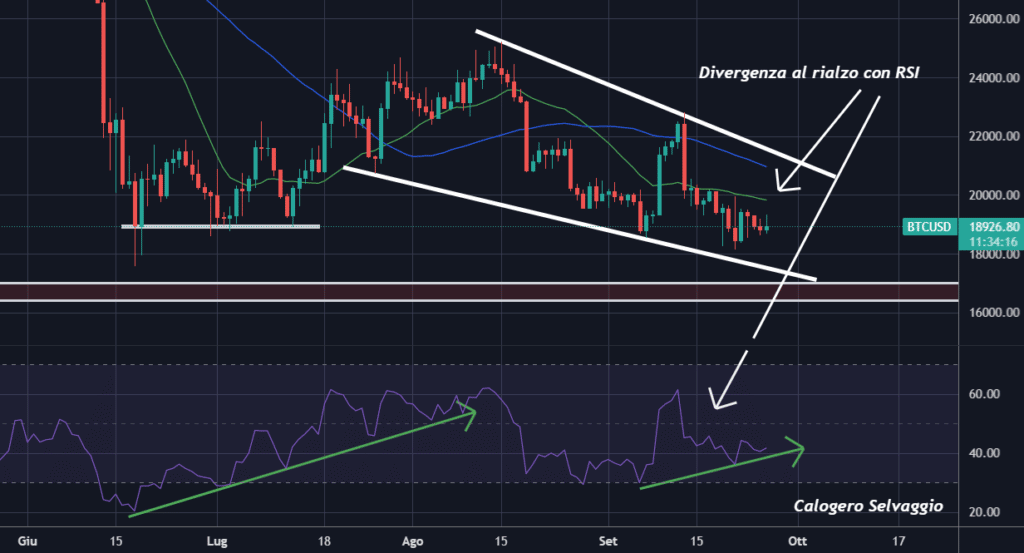
Finally, here is a final chart, a bullish divergence between the price of Bitcoin and the RSI that could signal a “likely” change of trend in the short term and a possible recovery of $19500 – $22000.
Conclusions
The theory of buying low to sell high is not so easy to apply. It turns out to be easy to be a “brave investor” when markets go up, and equally difficult when there are heavy losses and you don’t see the light at the end of the tunnel. One thing is certain, you will never buy the low, but if you take a long-term view, you will usually be “rewarded” by the market.