Summary
Bitcoin Analysis
Bullish Bitcoin traders marched BTC’s price higher again during Monday’s daily session and when the day’s candle was printed, BTC’s price was +$286.1.
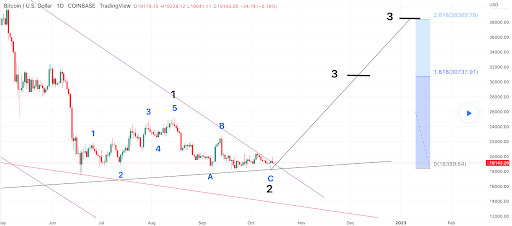
This Tuesday we’re beginning our price analyses as always with Bitcoin and today we’re starting with the BTC/USD 1D chart from BTC-XLM. BTC’s price is trading between the 0 fibonacci level [$18,389.54] and 1.618 [$30,737.91], at the time of writing.
The chartist below posits that BTC’s price is looking bullish and about to break out to the upside. If that breakout occurs the targets above for bullish BTC market participants are the 1.618 fib level followed by 2.618 [$38,369.78] on the daily time frame.
At variance with bullish market participants are those still shorting the Bitcoin market. They’ve targets below of a full retracement at the 0 fibonacci level followed by a retest of BTC’s 12-month low at $17,611 if they’re successful at cracking the 0 fib level to the downside.


Bitcoin’s Moving Averages: 5-Day [$19,254.14], 20-Day [$19,386.79], 50-Day [$20,537.34], 100-Day [$21,833.15], 200-Day [$30,502.04], Year to Date [$30,888.57].
BTC’s 24 hour price range is $19,152-$19,677 and its 7 day price range is $18,372.47-$19,872.75. Bitcoin’s 52 week price range is $17,611-$69,044.
The price of Bitcoin on this date last year was $62,034.
The average price of BTC for the last 30 days is $19,379.5 and its -1% over the same interval.
Bitcoin’s price [+1.49%] closed its daily candle worth $19,548.1 on Monday and in green figures for the second day in a row.
Ethereum Analysis
Ether’s price also climbed higher on Monday and concluded its daily trading session +$25.45.
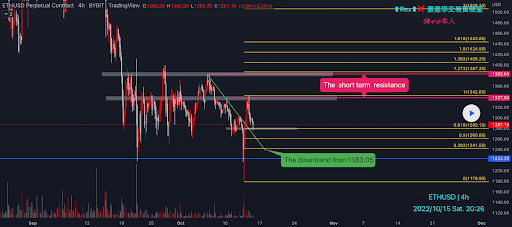
The second chart we’re looking at for today is an update of the chart we looked at for Monday – which is the ETH/USD 4HR chart below by Rex_yang. ETH’s price is trading between the 0.618 fib level [$1,280.1] and 1 [$1,342.65], at the time of writing.
After posting three consecutive daily candles in green figures, bullish Ether market participants are seeking to again challenge the 1 fib level. If they can send ETH’s price above that level again their next targets are 1.272 [$1,387.2], 1.382 [$1,405.2], 1.5 [$1,424.5], and 1.618 [$1,443.8].
Conversely, bearish Ether traders are aiming to push ETH’s price below the 0.618 and then to inflict more damage to bullish dreams. The targets to the downside after the 0.618 on ETH are 0.5 [$1,260.8], 0.382 [$1,241.5], and a full retracement at 0 [$1,178.95].

ETH’s 24 hour price range is $1,295.64-$1,338.57 and its 7 day price range is $1,216.50-$1,338.57. Ether’s 52 week price range is $883.62-$4,878.
The price of ETH on this date in 2021 was $3,747.62.
The average price of ETH for the last 30 days is $1,325.48 and its -10.19% over the same stretch.
Ether’s price [+1.95%] closed its daily candle on Monday valued at $1,331.4 and in green digits for the third time over the last four days.
Cardano Analysis
Cardano’s price made a fresh 12-month low on Saturday but has since followed that up with two consecutive positive daily sessions. On Monday, ADA’s price closed the day +$0.0021.
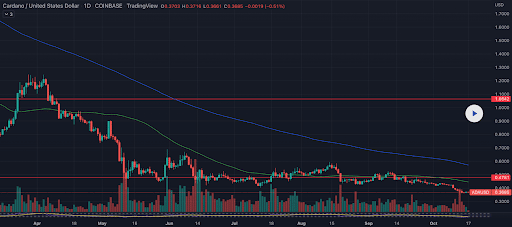
The final chart for analysis today is the ADA/USD 1D chart by XBTFX. Cardano’s price found support at the $0.4 level and was propped up there for multiple weeks until sellers were able to push the price below that threshold over the last week.
ADA’s price despite being oversold continues to look for a price reversal from bullish market participants that could test overhead resistance at the $0.4 level if bidders step-up.
Bearish traders of the ADA market are hoping to send ADA’s price below a new support level at $0.35 and then wish to make another fresh 12-month low.

Cardano’s 24 hour price range is $0.366-$0.375 and its 7 day price range is $0.357-$0.401. ADA’s 52 week price range is $0.3502-$2.37.
Cardano’s price on this date last year was $2.12.
The average price of ADA over the last 30 days is $0.4256 and its -20.46% over the same timespan.
Cardano’s price [+0.57%] closed Monday’s daily trading session worth $0.372 and in green figures for a second straight day.


