Summary
Bitcoin Analysis
Bitcoin’s price pulled back slightly on Thursday during the day’s second 12HR candle and BTC’s price closed the day -$485.
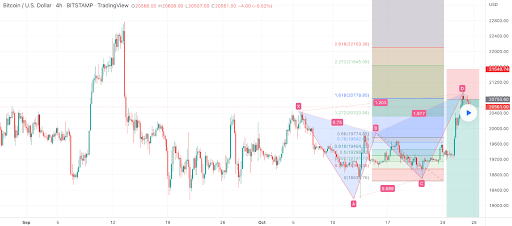
We’re leading-off our price analyses today with the BTC/USD 4HR chart below by holeyprofit. BTC’s price is trading between the 1.272 fibonacci level [$20,320.56] and the 1.618 fib level [$20,778.85], at the time of writing.
Bullish BTC market participants need to continue their increase in demand to make sure their rally doesn’t stallout below the $21k level. Their targets to the upside are 1.618, 2.272 [$21,645.09], and 2.618 [$22,103.38].
Contrariwise, bearish BTC traders want to again send BTC’s price below the 1.272 with a secondary target of the 0.86 fib level [$19,774.85]. If bearish traders can push BTC’s price below the 0.86 fib level their next targets are as follows, 0.786 [$19,642.40], 0.618 [$19,454.32], and 0.5 [$19,292.32].
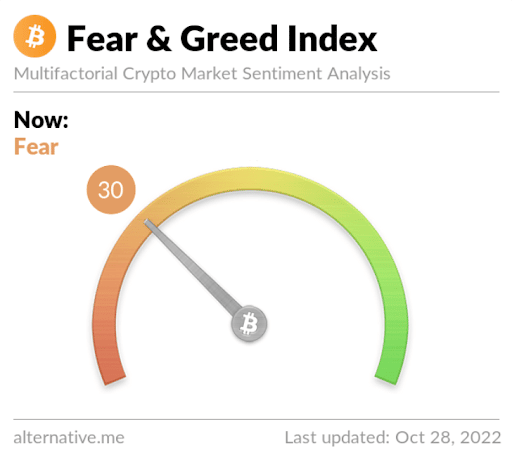
Bitcoin’s Moving Averages: 5-Day [$20,022.55], 20-Day [$19,609.33], 50-Day [$19,884.61], 100-Day [$20,965.61], 200-Day [$29,591.53], Year to Date [$30,470.87].
BTC’s 24 hour price range is $20,191-$20,892 and its 7 day price range is $18,788.33-$20,866.24. Bitcoin’s 52 week price range is $17,611-$69,044.
The price of Bitcoin on this date last year was $60,598.
The average price of BTC for the last 30 days is $19,482.9 and its +7.7% over the same interval.
Bitcoin’s price [-2.33%] closed its daily candle worth $20,303 and in red figures for the first time in three days on Thursday.
Ethereum Price Analysis
Ether’s price traded comfortably above its 2018 cycle top [$1,420] on Thursday despite finishing in red figures and when the day’s candle was printed, ETH was -$51.96.
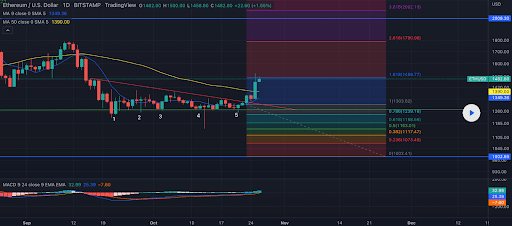
The ETH/USD 1D chart below from Cryptoslothx is the second chart of emphasis for this Friday. ETH’s price is trading between the 1.618 fibonacci level [$1,489.77] and 2.618 fib level [$1,790.98], at the time of writing.
At the time of writing, bullish Ether traders have been unable to regain the 1.618 level as bearish traders have proved that level is strong resistance on the daily time frame. If bullish traders regain that level their targets shift to the 2.618 fib level [$1,790.98] and 3.618 [$2,092.19].
Contrarily, the targets for those short the ETH market are the 1 fib level [$1,303.62], 0.786 [$1,239.16], 0.618 [$1,188.56], 0.5 [$1,153.01], and 0.382 [$1,117.47].
ETH’s 24 hour price range is $1,503.2-$1,578.58 and its 7 day price range is $1,264.48-$1,578.58. Ether’s 52 week price range is $883.62-$4,878.
The price of ETH on this date in 2021 was $4,284.51.
The average price of ETH for the last 30 days is $1,334.8 and its +16.92% over the same period.
Ether’s price [-3.32%] closed its daily session on Thursday worth $1,514.17 and in negative figures for the first time over three days.
Elrond Price Analysis
Elrond price also took a step back on Thursday and when traders settled-up on EGLD at 12:00 UTC, EGLD’s price was -$1.88.
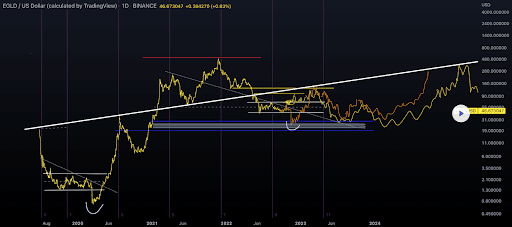
The EGLD/USD 1D chart below from Homocryptus is the final chart we’re analyzing for today. EGLD’s price has been one of the better performers during this bear trend.
The chartist below posits two scenarios for EGLD’s price over the short-term. The first scenario is a rally long to the $58 level with a secondary target of $69 and a third target at the $100 level.
The bearish scenario is that the asset’s price drops to the $39 level with an eventual test of the $22-$25 level if bulls can’t hold the $39 level. Each scenario is documented on the chart and traders can see how similar patterns have played out on the price of EGLD since late 2020 when the asset launched.
EGLD’s Moving Averages: 5-Day [$56.94], 20-Day [$55.56], 50-Day [$52.70], 100-Day [$54.44], Year to Date [$80.87].
Elrond’s 24 hour price range is $54.85-$58.5 and its 7 day price range is $54.07-$58.62. EGLD’s 52 week price range is $38.07-$542.7.
Elrond’s price on this date last year was $256.87.
The average price of EGLD over the last 30 days is $54.06 and its +18.05% for the same span.
Elrond’s price [-3.29%] closed its daily candle on Thursday valued at $55.26 and in negative figures for the second time in three days.


