Summary
Bitcoin Analysis
Bitcoin’s price could be in the midst of painting a bullish Gartley pattern on the daily timescale and finished marginally in negative figures on Tuesday [-$12.6].
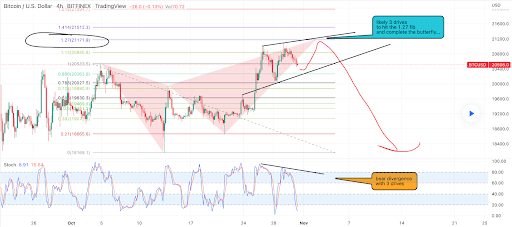
The BTC/USD 4HR chart below from LevRidge is the first chart we’re diving into for this Wednesday. BTC’s price is trading between the 0.886 fibonacci level [$20,263.9] and the 1 fib level [$20,533.5], at the time of writing.
The overhead targets on BTC for those expecting further upside on this rally back above $19,891 are the 1 fib level, 1.13 [$20,840.8], 1.27 [$21,171.9], and 1.414 [$21,512.3].
Contrariwise, bearish traders of the BTC market have a primary aim of pushing BTC’s price below the 0.886 followed by targets of 0.786 [$20,027.5], 0.721 [$19,880.9], and 0.618 [$19,630.3] over the interim.


Bitcoin’s Moving Averages: 5-Day [$20,531.43], 20-Day [$19,706.07], 50-Day [$19,832.88], 100-Day [$20,834.5], 200-Day [$29,347.09], Year to Date [$30,322.08].
BTC’s 24 hour price range is $20,330.7-$20,700 and its 7 day price range is $20,095.15-$20,924.82. Bitcoin’s 52 week price range is $19,611-$69,044.
The price of Bitcoin on this date last year was $47,675.
The average price of BTC for the last 30 days is $19,672 and its +4.3% over the same interval.
Bitcoin’s price [-0.06%] closed its daily candle worth $20,483.7 on Tuesday and in red figures for a third straight day.
Ethereum Analysis
Ether’s price outperformed BTC’s price on Tuesday and finished its daily candle +$6.77.
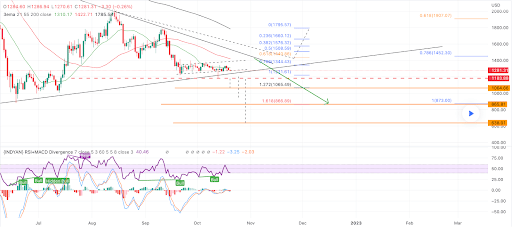
The second chart we’re analyzing today is the ETH/USD 1D chart below by trieisdi9. ETH’s price is trading between the 0.5 fibonacci level [$1,508.59] and 0.382 [$1,576.32], at the time of writing.
The targets on Ether to upside are 0.382, 0.236 [$1,660.12], and a full retracement at 0 [$1,795.57].
Bearish ETH traders are conversely looking to put an end to the recent upward mobility of bullish market participants. Their targets to the downside of the daily timescale are 0.5, 0.618 [$1,440.86], 0.786 [$1,344.43], 1 [$1,221.61], and the 1.272 fib level [$1,065.49].

ETH’s 24 hour price range is $1,563.69-$1,612.92 and its 7 day price range is $1,470.78-$1,645.08. Ether’s 52 week price range is $883.62-$4,878.
The price of ETH on this date in 2021 was $3,388.26.
The average price of ETH for the last 30 days is $1,372.24 and its +17.57% over the same stretch.
Ether’s price [+0.43%] closed its daily session worth $1,579.63 on Tuesday and broke a streak of two consecutive days in red digits.
Dogecoin (DOGE) Analysis
Dogecoin’s price (DOGE) marked up over 12% during its trading session on Tuesday and has finished in green figures for 7 out of the last 8 days. When traders settled-up on Tuesday at 12:00 UTC, DOGE’s price was +$0.01539.
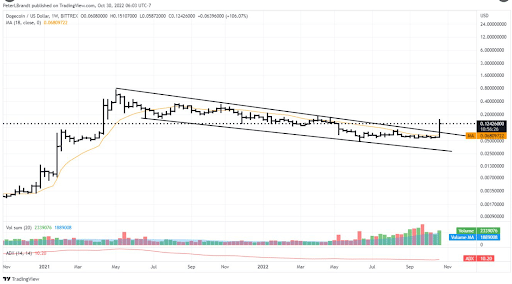
The DOGE/USD 1W chart from @PeterLBrandt shows that Dogecoin’s price has broken out of a descending channel that dates back to May 8th of 2021. Traders may remember that day because it was the same date that Elon Musk appeared on Saturday Night Live.

With Musk’s recent acquisition of twitter, the price of DOGE consequently seems to be benefiting. DOGE’s price is +81.48% since Musk tweeted, “the bird is freed” on October 27th.
the bird is freed
— Elon Musk (@elonmusk) October 28, 2022
Dogecoin’s Moving Averages: 5-Day [$0.100436], 20-Day [$0.070532], 50-Day [$0.065243], 100-Day [$0.066361], 200-Day [$0.094058], Year to Date [$0.099157].
Doge is +105.3% against The U.S. Dollar over the last 90 days, +136.2% against BTC, and +115.9% against ETH, over the same duration.
Dogecoin’s 24 hour price range is $0.12448-0.15893 and its 7 day price range is $0.063466-$0.15893. DOGE’s 52 week price range is $0.0492-$0.2966.
Dogecoin’s price on this date last year was $0.2185.
The average price of DOGE over the last 30 days is $0.070 and its +125.5% over the same period.
Dogecoin’s price [+12.13%] closed its daily candle worth $0.142220 on Tuesday.


