Bitcoin Analysis
The aggregate cryptocurrency market experienced one of the most volatile trading days arguably in years on Tuesday. BTC’s price followed suit Tuesday and lost -10.1% of its value and finished its daily trading session -$2,060.5.
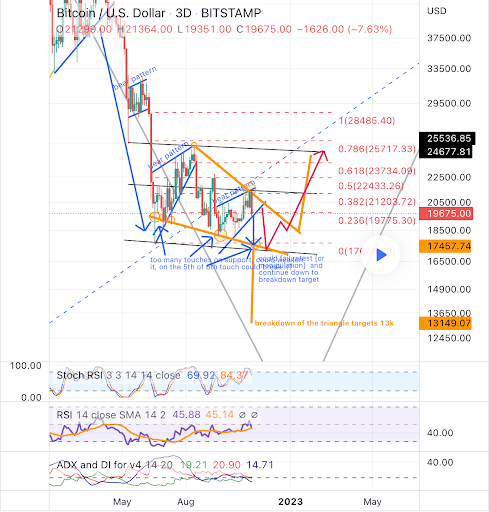
The first chart we’re looking at today is the BTC/USD 3D chart from LatinUnit. BTC’s price is trading between the 0 fibonacci level [$17,666.09] and 0.236 [$19,775.30], at the time of writing.
The targets for bulls if they want to prove the prior three days were a bear trap are, 0.382, 0.5 [$22,433.26], 0.618 [$23,734.09], 0.786 [$25,717.33], and the 1 fib level [$28,485.40].
Contrariwise, bearish market participants have targets to the downside of the 3D chart of the 0 fibonacci level and BTC’s 12-month low of $17,611.


Bitcoin’s Moving Averages: 5-Day [$20,355.12], 20-Day [$19,903.71], 50-Day [$19,786.1], 100-Day [$20,809.81], 200-Day [$28,918.21], Year to Date [$30,107.52].
BTC’s 24 hour price range is $17,166.8-$20,700.9 and its 7 day price range is $17,166.8-$21,417.69. Bitcoin’s 52 week price range is $17,611-$69,044.
The price of Bitcoin on this date last year was $66,935.
The average price of BTC for the last 30 days is $19,873.3 and its +0.5% over the same span.
Bitcoin’s price [-10.01%] closed its daily candle worth $18,528.3 and in red figures for a third consecutive time on Tuesday.
Summary
Ethereum Analysis
The aggregate crypto market cap was down at times more than $145 billion dollars for a 60 hour span on Tuesday and ETH’s price wasn’t spared. Ether also finished down double digits by percentage and -$232.23 for Tuesday’s session.
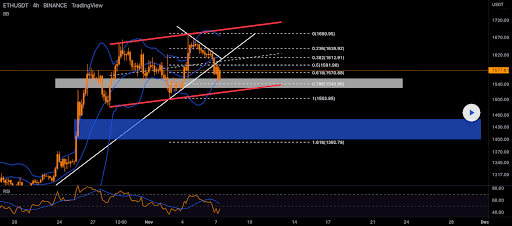
The ETH/USD 4HR chart below by MonoCoinSignal is the second chart we’re examining for this Tuesday. Bullish Ether traders lost the 0.786 fib level on Tuesday as well as the 1 fibonacci level [$1,502.85] and 1.618 [$1,392.78] before finding support at the $1,252 level.

Ether’s Moving Averages: 5-Day [$1,547.33], 20-Day [$1,438.13], 50-Day [$1,443.53], 100-Day [$1,462.66], 200-Day [$2,013.99], Year to Date [$2,115.40].
ETH’s 24 hour price range is $1,233-$1,579.98 and its 7 day price range is $1,233-$1,659.61. Ether’s 52 week price range is $883.62-$4,878.
The price of ETH on this date in 2021 was $4,731.68.
The average price of ETH for the last 30 days is $1,420.91 and its +6.63% over the same duration.
Ether’s price [-14.82%] closed its daily trading session on Tuesday valued at $1,335.23 and in negative digits for the fourth day in a row.
XRP Analysis
XRP’s price was the second worst performer of today’s price analyses and when traders settled up on Tuesday, XRP’s price was -$0.059.
The last chart we’re examining today is the XRP/USD 1D chart below from Anica. XRP’s price is trading between the 0.618 fib level [$0.40718] and 0.5 [$0.43640], at the time of writing.
Bullish traders have overhead targets on the XRP daily time frame of 0.5, 0.382 [$0.46562], 0.236 [$0.50177] and a full retracement at 0 [$0.56021].
The chartist posits that a harmonic bearish Shark pattern could be playing out that takes XRP’s price back down to retest the $0.29 level. The targets that need to be breached to the downside to see the $0.29 level again are the 0.618, 0.702 [$0.38638], 0.886 [$0.34082], and the 1 fibonacci level [$0.31259].

XRP/USD 1D chart: the price is trading between the 0.618 fib level [$0.40718] and 0.5 [$0.43640]
XRP’s Moving Averages: 5-Day [$0.446], 20-Day [$0.459], 50-Day [$0.433], 100-Day [$0.391], 200-Day [$0.512], Year to Date [$0.533].
Ripple’s 24 hour price range is $0.335-$0.466 and its 7 day price range is $0.335-$0.502. XRP’s 52 week price range is $0.2876-$1.34.
Ripple’s price on this date last year was $1.25.
The average price of XRP over the last 30 days is $0.473 and its -18.98% over the same interval.
XRP’s price [-12.69%] closed its daily candle worth $0.406 and in red figures for a four straight day on Tuesday.


