Bitcoin Analysis
Bitcoin’s price continued to slide lower on Sunday and when the week’s final daily candle was printed, BTC’s price was -$471.3.
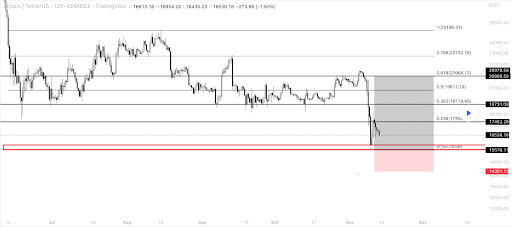
The BTC/USD 12HR chart below from DanilBlinkov is the first chart we’re looking at for this Monday. BTC’s price is trading between the 0 fibonacci level [$15,578.58] and 0.236 [$17,450.46], at the time of writing.
Bullish Bitcoin market participants want to regain the 0.236 fib level with targets after that of 0.382 [$18,719.45], 0.5 [$19,812.2], and the 0.618 fib level [$20,968.73] to ultimately regain the first level above BTC’s former ATH made in 2017 of $19,891.
Contrariwise, bearish traders that controlled BTC’s price action last week [-22.1%] have a primary target of retesting a full retracement at the 0 fib level.
Bitcoin’s Moving Averages: 5-Day [$17,935.43], 20-Day [$19,490.27], 50-Day [$19,570.5], 100-Day [$20,685.79], 200-Day [$28,592.87], Year to Date [$29,925.92].
BTC’s 24 hour price range is $16,229-$16,954.3 and its 7 day price range is $15,742.44-$21,011.16. Bitcoin’s 52 week price range is $15,603-$66,320.
The price of Bitcoin on this date last year was $65,471.
The average price of BTC for the last 30 days is $19,447.6 and its -12.4% over the same period.
Bitcoin’s price [-2.81%] closed its daily candle worth $16,327.3 on Sunday and in negative figures for a third straight day.
Summary
Ethereum Analysis
Ether’s price followed BTC’s price and the aggregate market cap lower on Sunday and ETH’s price concluded its daily frame -$34.81.
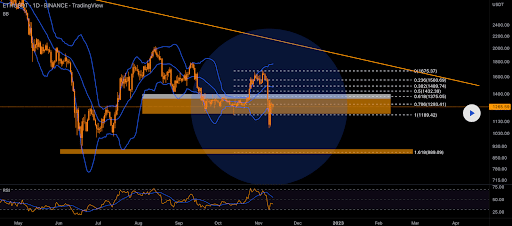
The ETH/USD 1D chart below by MonoCoinSignal is the second chart we’re looking at for the new week. ETH’s price is trading between the 1 fib level [$1,189.42] and 0.786 [$1,293.41], at the time of writing.
The targets to the upside for bullish traders that believe a pivot is forthcoming are 0.786, 0.618 [$1,375.05], 0.5 [$1,432.39], 0.382 [$1,489.74], and 0.236 [$1,560.69].
Conversely, bearish traders are seeking to push ETH’s price below the 1 fib level with a secondary target of 1.618 [$889.09].
ETH’s 24 hour price range is $1,200.66-$1,274.33 and its 7 day price range is $1,095.18-$1,605.9. Ether’s 52 week price range is $883.62-$4,878.
The price of ETH on this date in 2021 was $4,625.76.
The average price of ETH for the last 30 days is $1,406.95 and its -3.07% over the same stretch.
Ether’s price [-2.77%] closed its daily candle on Sunday worth $1,221.41 and in red figures for the eighth time over the last nine days.
Luna Analysis
All three assets covered today finished within 0.04% of each other for Sunday and LUNA’s price finished its session -$0.0472.
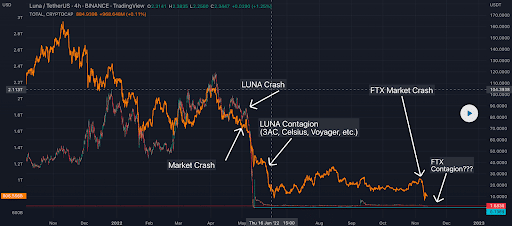
The LUNA/USD 4HR chart below from CryptoBrrr is the final chart we’re inspecting today.
The chartist provided insights as to what’s happened following major individual events like the collapse of LUNA and Anchor protocol earlier this year.
We can see that after the collapse of LUNA soon thereafter the market experienced a crash. The LUNA contagion spread and 3AC, Celsius, and Voyager’s fate also suffered as a result.
The FTX and Alameda collapse and saga are very similar events that invariably will lead to other problems. The chartist denotes that the FTX contagion could spell lower prices on LUNA.
LUNA’s price is -15.48% against The U.S. Dollar over the last 90 days, +24.01% against BTC, and +32.25% against ETH, over the same interval.
The 24 hour price range of LUNA is $1.62-$1.80 and its 7 day price range is $1.58-$2.43.
The average price of LUNA over the last 30 days is $2.35 and its -31.59% over the same time frame.
LUNA’s price [-2.77%] closed its daily trading session on Sunday worth $1.65 and in negative figures for the fifth time over the last six daily sessions.


