This article will evaluate one of the best-performing strategies that uses the trend-following logic: the Opening Range Breakout (ORB).
This strategy, which will be applied to Ethereum, is based on the assumption that upon reaching a certain threshold of gains of the underlying from the opening of the day (e.g., 2.5% up), the market will continue in the direction it is going.
Somewhat like wanting to enter the market only after it has shown some strength and thus it is more likely that the direction of the trend will not change until the end of the day. The job of the systematic trader will be to identify the threshold beyond which this market tends not to reverse.
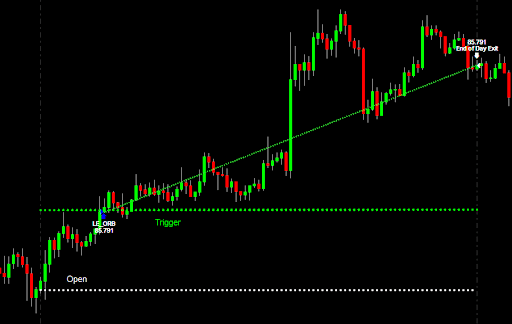
Figure 1 shows an example of the pattern in question, which identifies a percentage threshold from the day’s open above which the strategy will enter the market.
Trades will be closed at the end of each session, so this is an intraday strategy built on 15-minute bars, which will be tested over a time frame of about 5 years (August 2017 to the present).
In Figure 2, rotating the thresholds from 0% to 10% with 0.5% steps (0 – 0.5 – 1 – 1.5 etc.) we see what the percentages are above which it is convenient to buy Ethereum. Obviously the underlying has risen so much in the years used for the backtest, and in all cases, buying ETH would have shown a profit at the end of 5 years. What varies is all the other data, including drawdown and total number of trades.
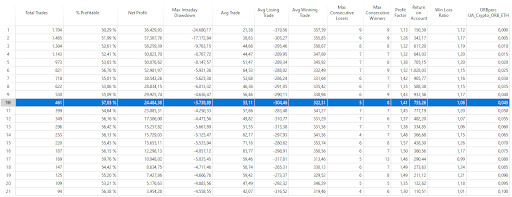
As the percentage increases, the strategy will trade less and less. This is obvious since as the threshold increases, the difficulty of seeing a certain percentage upside realized from the opening also increases. This means that the lower the percentage threshold is applied, the greater the total number of trades in history.
Analyzing the results shows that the first values ranging from 0.5% to 3% are the ones that bring the most profit to the system. However, these percentages are to be put in context with the average volatility of ETH, which is very high, especially when compared to traditional markets. These thresholds are easily reached by the market, which implies a high number of trades that could hide pitfalls. In fact, a higher number of trades implies more fees to be paid and more exposure to slippage risk.
Drawdowns are also very high (-$9,100 with 1%), considering that the position set for each trade is $10,000.
Therefore, an intermediate value is chosen, which can be a good compromise between the total number of trades (better to stay under 100/year and over 20/year), average trade and drawdown. The value 4.5% seems to be the most suitable, since the drawdown figure is the lowest of all the cases considered and the average trade remains good for an intraday-type strategy.
At this point, we proceed to enter classic exits from the trade, namely stop-loss and take-profit. In addition to these exits, one will close the long position if the market breaks the low of the previous session.
The optimal values for stop-loss and take-profit are 4% and 15%, respectively. Basically, if prices fall a good 4% from the loading price, then the positions will be closed in stop loss, while if the market goes up at least 15% then the positions will be closed in take-profit.
The next figures show the results of the overall strategy of all the rules just listed. The profit curve is upward sloping, and despite the fact that in the last period (2022) this market suffered very strong drawdowns, of more than 80% (as visible in Figure 6), the analyzed strategy was able to keep itself toned down, reducing the risks from simply buying&holding ETH.
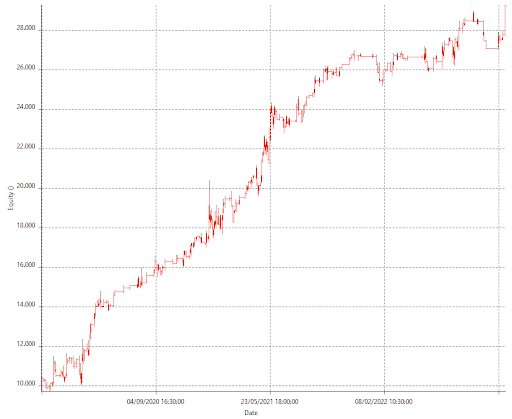
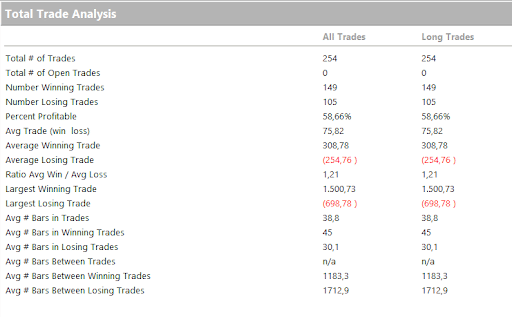
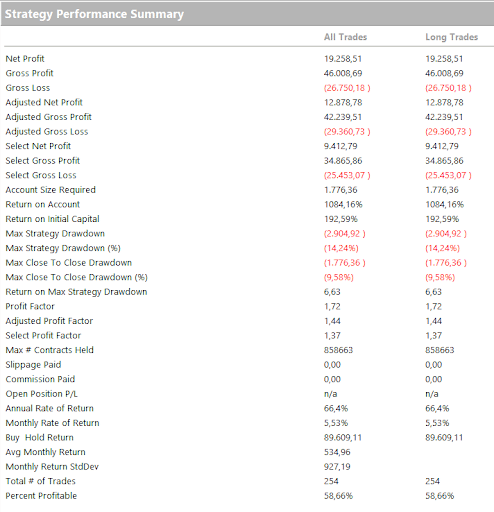
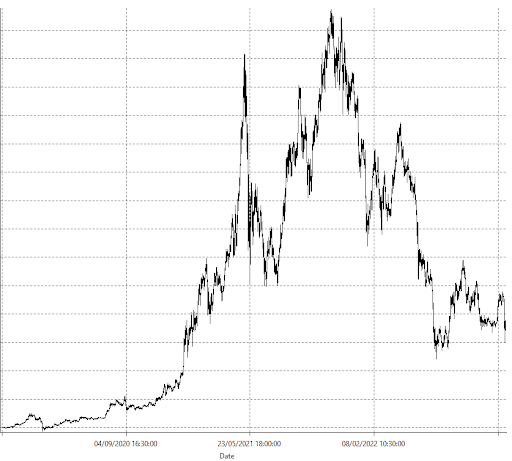
Finally, the drawdown does not exceed $3,000, compared to a return of more than $19,000 during the period under consideration. A nice sum when compared with the capital set for each trade, which amounts to $10,000.
In conclusion, this strategy has proven that it can be used profitably on the world’s second most popular crypto. Like other cryptocurrencies, Ethereum also responds very well to trend-following logic, and the strategy on the opening range breakout fits the nature of this market very well.
Until next time!


