Bitcoin Analysis
Bitcoin’s price made its lowest daily candle close since November 11th, 2020 on Monday and when traders settled-up for the 24 hour trading session, BTC’s price was -$510.9.
The BTC/USD 1W chart from andre_007 is where we’re leading-off this Tuesday’s price analyses. At the time of writing, BTC’s price is trading between the 0.5 fibonacci level [$14,682.79] and 0.618 fib level [$21,154.7].
As noted in yesterday’s article, BTC market participants didn’t have the luxury of much historical support above the $16k level on the daily timescale and they lost that level on Monday. Looking below we can also see there’s very little support until the 0.5 fib level on the weekly time frame.
Bullish BTC market participants need to regain the 0.618 fib level to really begin to achieve a technical reversal. The targets after that level are 0.702 [$27,435.14], 0.786 [$35,580.14], 0.893 [$49,547.45], and the 1 fib level [$68,997.75].
The picture is so exceptionally different for bearish BTC traders that have sent BTC’s price into territory not seen since November of 2020. The targets to the downside for bears are 0.5, 0.382 [$10,190.85], 0.191 [$5,642.82], and a full retracement back to the March of 2020 covid crash low at the 0 fib level [$3,124.51].


Bitcoin’s Moving Averages: 5-Day [$16,584.73], 20-Day [$18,671.53], 50-Day [$19,132.77], 100-Day [$20,485.78], 200-Day [$27,782.63], Year to Date [$29,578.56].
BTC’s 24 hour price range is $15,476-$16,319 and its 7 day price range is $15,476-$17,044.68. Bitcoin’s 52 week price range is $15,603-$59,423.4.
The price of Bitcoin on this date last year was $56,299.
The average price of BTC for the last 30 days is $18,781.6 and its -15.8% over the same stretch.
Bitcoin’s price [-3.14%] closed its daily candle worth $15,799 and in negative figures for a second day in a row on Monday.
Summary
Ethereum Analysis
Ether’s price also trended lower on Monday and finished Monday’s trading session -$35.39.
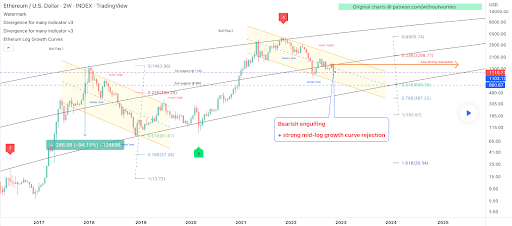
The ETH/USD 2W chart below by without_worries is the second chart we’re looking at for this Tuesday. ETH’s price is trading between the 0.618 fib level [$666.2] and 0.236 [$2,228.77], at the time of writing.
We can see that the chartist posits that if bulls can overcome the 0.618 that the $1,550 level will prove to be ‘new strong resistance’ overhead. Above that level the targets for those longing Ether are 0.236 and a full retracement at 0 [$4,905.74].
Conversely, the targets to the downside on ETH are 0.618, 0.786 [$387.22], and the 1 fib level [$193.97].

ETH’s 24 hour price range is $1,079.76-$1,146.99 and its 7 day price range is $1,079.76-$1,277.08. Ether’s 52 week price range is $883.62-$4,778.
Ether’s price on this date in 2021 was $4,086.52.
The average price of ETH for the last 30 days is $1,382.41 and its -12.92% over the same period.
Ether’s price [-3.10%] closed its daily session valued at $1,107.49 on Monday and in red digits for a second consecutive day.
Litecoin Analysis
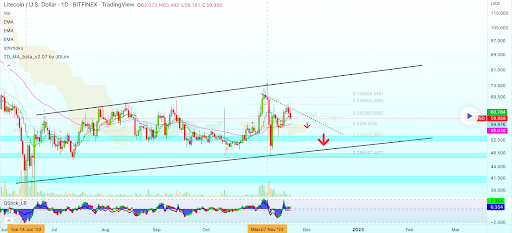
The LTC/USD 1D chart from AlanSantana caps-off our price analyses for this Tuesday. LTC’s price is trading between the 0.382 fibonacci level [$60.69] and 0.236 [$65.468], at the time of writing.
The overhead targets on LTC for bullish traders are 0.236 and the 0.148 [$68.349].
At variance with those longing LTC are bearish traders that want to push Litecoin’s price back below the 0.382 fib level followed by targets of 0.5 [$56.828], 0.618 [$52.965], and the 0.786 fib level [$47.467].

Litecoin’s 24 hour price range is $59.25-$63.91 and its 7 day price range is $56.77-$64.32. LTC’s 52 week price range is $40.4-$229.6.
Litecoin’s price on this date last year was $209.1.
The average price of LTC over the last 30 days is $58.54 and its -20.36% over the same interval.
Litecoin’s price [-1.22%] closed its trading session on Monday worth $61.34 and in red figures for a second straight day.


