Bitcoin Analysis
Bitcoin’s price scaled higher for the third consecutive daily session on Wednesday and concluded the day +$16.5.
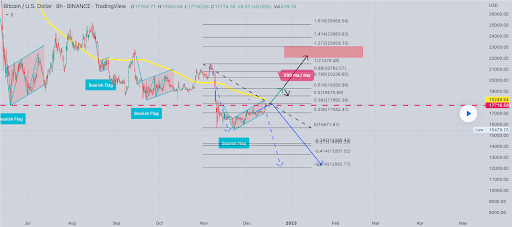
The BTC/USD 8HR chart below from ys03korea is the primary chart for Thursday’s price analyses. At the time of writing, BTC’s price is trading between the 0.382 fibonacci level [$17,890.38] and 0.5 fib level [$18,575.68].
One of the theories surrounding the recent surge of BTC’s price is that Binance is potentially being forced to purchase BTC to cover user withdrawals. We’ll have to see if this is true over the coming weeks and whether or not bullish traders can continue to control BTC’s price action or this is a short-term rally.
The overhead targets if bulls wish to continue the rally on BTC are 0.5, 0.618 [$19,260.98], 0.786 [$20,236.65], 0.88 [$20,782.57] and the 1 fibonacci level [$21,479.48].
From a contrary perspective, bearish traders are hoping this rally fizzles out and they can continue their larger downtrend of 2022. To the downside the targets on Bitcoin are 0.382, 0.236 [$17,042.47], 0 [$15,671.87], -0.242 [$14,266.42], and the -0.272 fib level [$14,092.20].


Bitcoin’s Moving Averages: 5-Day [$17,471.84], 20-Day [$16,823.76], 50-Day [$18,233.84], 100-Day [$19,704.04], 200-Day [$25,777.73], Year to Date [$28,708.19].
BTC’s 24 hour price range is $17,660.9-$18,388 and its 7 day price range is $16,809.55-$18,388. Bitcoin’s 52 week price range is $15,501-52,027.
The price of Bitcoin on this date last year was $48,901.
The average price of BTC for the last 30 days is $16,810.3 and its +7.8% over the same span.
Bitcoin’s price [+0.11%] closed its daily candle worth $17,799 on Wednesday.
Summary
Ethereum Analysis
Ether’s price closed Wednesday’s session lower than it began the day as bulls were unsuccessful in their bid to follow BTC’s price higher. When the day’s candle was painted, ETH’s price was -$13.49.
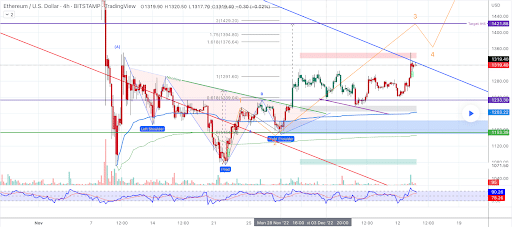
The ETH/USD 4HR chart by zippy1day is the second chart on the docket for this Thursday. ETH’s price is trading between the 1 fibonacci level [$1,291.60] and the 1.618 [$1,376.64], at the time of writing.
The upside targets for bulls of Ether’s market are 1.618, 1.75 [$1,394.80] and the 2 fib level [$1,429.20].
Conversely, the levels of interest to the downside for bearish traders are the 1 fib and the 0.618 fibonacci level [$1,239.04] on the 4HR timescale.

ETH’s 24 hour price range is $1,301-$1,352.72 and its 7 day price range is $1,228.16-$1,352.72. Ether’s 52 week price range is $883.62-$4,148.85.
The price of ETH on this date in 2021 was $4,018.94.
The average price of ETH for the last 30 days is $1,233.44 and its +6.43% for the same interval.
Ether’s price [-1.02%] closed its daily candle on Wednesday worth $1,307.24 and in red figures for the first time in three days.
Solana Analysis
Solana was the best performer of the assets covered today and when traders settled-up on Wednesday, SOL’s price was +$0.26.
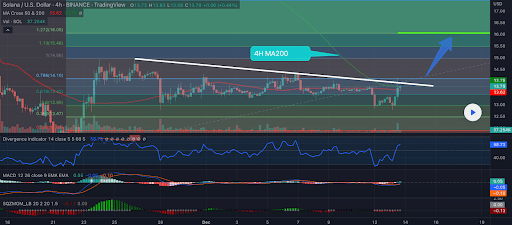
We’re concluding our price analyses this Thursday with the SOL/USD 4HR chart by peterbhc. At the time of writing, Solana’s price is trading between the 0.786 fibonacci level [$14.10] and 1 fib level [$14.96].
Bullish traders have rallied SOL’s price 30.74% from the depths of the bear market and their targets to the upside are the 1 fib, 1.13 [$15.48] and the 1.272 fib level [$16.05].
Against the bullish pressure are bearish SOL traders that still want to see new lows made for the asset during this bear market. The targets on the 4HR time frame on SOL below the 0.786 are 0.618 [$13.42], 0.5 [$12.95], and 0.382 [$12.47].

Solana’s price on this date last year was $178.57.
The average price of SOL over the last 30 days is $13.61 and its -1.23% over the same duration.
Solana’s price [+1.87%] closed its daily session on Wednesday worth $14.13 and in positive figures for a second straight day.


