Bitcoin Analysis
After closing Sunday’s daily candle above the 1D 50MA for the first time in over two months, BTC’s price followed that momentum up to begin the new week on Monday with a green daily candle and +$61.
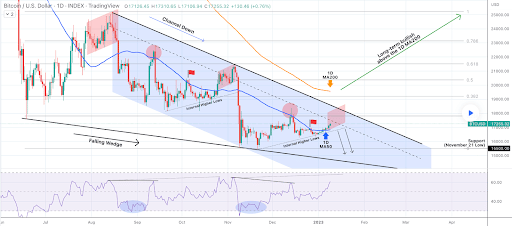
The BTC/USD 1D chart below from TradingShot is the first undertaking of today’s price analyses. BTC’s price continued its charge higher on Monday and we can see on the daily timescale below that it’s making ‘Internal Higher Lows.’
While the last week has been mostly dominated by bullish BTC traders, they still have their work cut-out to regain the 1D MA200 at the $19,565 level.
From the bearish perspective, they’re again looking to send BTC’s price below the 1D MA50 before retesting BTC’s multi-year low of $15,505.

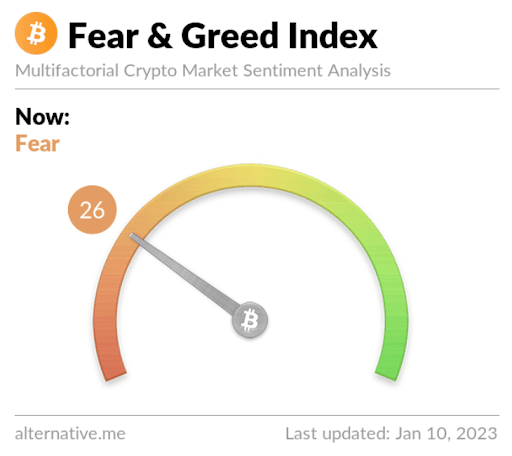
The Fear and Greed Index is 26 Fear and is +1 from Monday’s reading of 25 Extreme Fear.

Bitcoin’s Moving Averages: 5-Day [$16,900.76], 20-Day [$16,924.48], 50-Day [$17,277.01], 100-Day [$18,572.36], 200-Day [$23,558.06], Year to Date [$16,874.50].
BTC’s 24 hour price range is $17,123-$17,400 and its 7 day price range is $16,690-$17,400. Bitcoin’s 52 week price range is $15,505-$48,162.9.
The price of Bitcoin on this date last year was $41,830.3.
The average price of BTC for the last 30 days is $16,914.4 and its +2.5% over the same duration.
Bitcoin’s price [+0.36%] closed its daily candle worth $17,180.1 on Monday and in green digits for the seventh time in nine days.
Summary
Ethereum Analysis
On Monday, ETH’s price once again marked-up and when traders concluded for the day, ETH’s price was +$32.24.
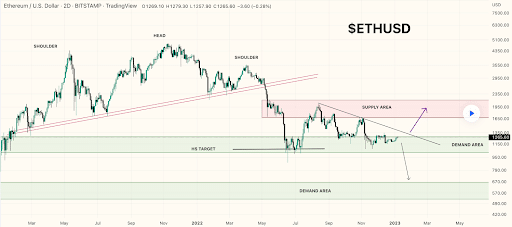
The second chart we’re looking at today is the ETH/USD 2D chart by BojBrouns. ETH’s price is trading just above the ‘Demand Area’ labeled on the chart below, at the time of writing.
Bullish Ether market participants are aiming for a breakout above the trendline at the $1,343 level. If they’re successful in that aim the next target is the bottom of the ‘Supply Area’ which coincides with the $1,682 level.
If bulls have their way they may be able to again break the $2k level in a bid to go and test the top of the ‘Supply Area’ at $2,160.
Conversely, bearish Ether market participants are hoping to negate the last few days of bullish price action and use the recent optimism around the macro cryptocurrency market to provide liquidity to short-sellers.

Ether’s Moving Averages: 5-Day [$1,260.45], 20-Day [$1,235.88], 50-Day [$1,271.77], 100-Day [$1,361.69], 200-Day [$1,654.17], Year to Date [$1,253.65].
ETH’s 24 hour price range is $1,281.99-$1,344.91 and its 7 day price range is $1,213-$1,344.91. Ether’s 52 week price range is $883.62-$3,579.96.
The price of ETH on this date in 2022 was $3,085.46.
The average price of ETH for the last 30 days is $1,235.13 and its +7.33% over the same period.
Ether’s price [+2.50%] closed its daily session on Monday worth $1,320.49 and ETH’s also finished seven of the last nine daily candles in positive figures.
Matic Analysis
Matic’s price finished Monday less than 1% higher than it did on Sunday. Polygon continued its streak of green daily candles and when traders settled-up, MATIC was +$0.003.
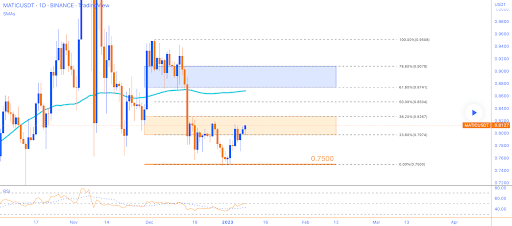
The final chart for analysis this Tuesday is the MATIC/USD 1D chart via MonoCoinSignal. MATIC’s price is trading between the 38.20% fibonacci level [$0.8267] and the 50.00% fib level [$0.8504], at the time of writing.
Targets to the upside on MATIC are 50.00%, 61.80% [$0.8741], 78.60% [$0.9079], and the 100.00% fibonacci level [$0.9508].
Contrariwise, the targets to the downside for bearish MATIC market participants are 38.20%, 23.60% [$0.7974], and a full retracement at 0 [$0.7500].

MATIC’s price is +5.97% against The U.S. Dollar over the last 90 days, +17.19% against BTC, and +3.05% against ETH over the same stretch.
Polygon’s 24 hour price range is $0.835-$0.877 and its 7 day price range is $0.78-$0.877. MATIC’s 52 week price range is $0.317-$2.451.
Polygon’s price on this date last year was $2.07.
The average price of MATIC over the last 30 days is $0.822 and its -6.13% over the same time frame.
Polygon’s price [+0.35%] printed a green daily candle on Monday and finished the day worth $0.843. Monday’s trading session was the fourth day in a row that market participants sent MATIC’s price higher.


