Bitcoin Analysis
Bitcoin’s price closed its weekly candle +21.38% on Sunday but in red digits for its daily session and -$77.5.
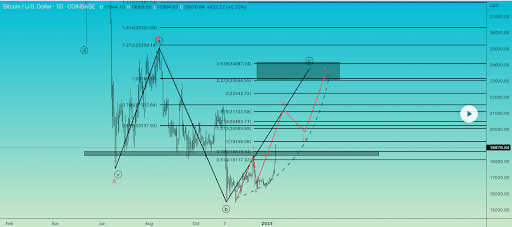
The BTC/USD 1D chart below from Cross10XSignals is the first chart we’re analyzing for this Monday. BTC’s price is trading between the fibonacci level 1.414 [$20,493.71] and the 1.618 fib level [$21,102.58], at the time of writing.
Bullish traders want to maintain control of the $20k level and regain the 1.618 fib level. If they’re successful in that aim their next targets are the 2 fib level [$22,242.72], 2.272 [$23,054.55], and the 2.618 fibonacci level [$24,087.24].
Those that have been shorting the BTC market for the last 13 months arguably hadn’t lost control of the asset’s price action until last week. Bearish market participants want to firstly send BTC’s price back below the 1.414. Bearish traders have a secondary aim of 1.272 [$20,069.89] on Bitcoin.
If they’re successful at that level then their focus shifts to the most important level of inflection on BTC’s chart in the interim and the asset’s 2017 all-time high [$19,891]. Below BTC’s 2017 ATH the next two targets to the downside are 1 [$19,258.06] and the 0.786 fib level [$18,619.34].


Bitcoin’s Moving Averages: 5-Day [$18,170.72], 20-Day [$17,096.48], 50-Day [$17,122.85], 100-Day [$18,488.98], 200-Day [$23,028.06], Year to Date [$17,485.27].
BTC’s 24 hour price range is $20,566-$21,093 and its 7 day price range is $17,139-$21,093. Bitcoin’s 52 week price range is $15,505-$48,162.9.
The price of Bitcoin on this date last year was $43,072.3.
The average price of BTC for the last 30 days is $17,288.4 and its +17.3% for the same duration.
Bitcoin’s price [-0.37%] closed its daily candle worth $20,879 on Sunday and in red figures for the first time over the last eight days.
Summary
Ethereum Analysis
Ether’s price closed its weekly candle +20.87% and in positive digits [+$0.62] again on Sunday for its daily session.
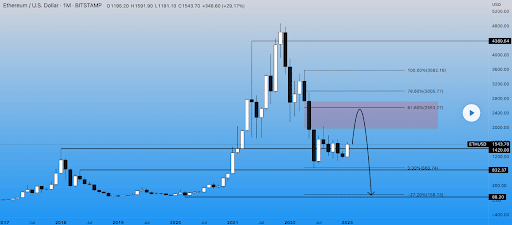
The second chart on the docket for this Monday is the ETH/USD 1M chart by MrTradesFX. At the time of writing, ETH’s price is trading between the 0.00% fibonacci level [$888.74] and the 61.80% fib level [$2,553.27].
The targets to the upside on Ether are 61.80%, 78.60% [$3,005.77], and the 100.00% fib level [$3,582.16].
Contrariwise, the targets of interest to bearish traders begin with ETH’s multi-year low and the 0.00% fib level. The secondary aim below the 0.00% level is the -27.20% fib level [$156.13].

ETH’s 24 hour price range is $1,516.03-$1,566.66 and its 7 day price range is $1,288.25-$1,566.66. Ether’s 52 week price range is $883.62-$3,579.96.
The price of ETH on this date in 2022 was $3,346.47.
The average price of ETH for the last 30 days is $1,265.97 and its +17.01% over the same stretch.
Ether’s price [+0.04%] closed its daily candle on Sunday worth $1,550.68 and in positive digits for an eighth consecutive day.
Avalanche Analysis
Avalanche’s price followed Bitcoin lower on Sunday and marked-down -$0.15.
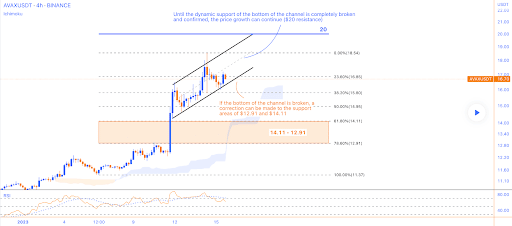
We’re concluding our price analyses for this Monday with the AVAX/USDT 4HR chart via MonoCoinSignal. AVAX’s price is trading between the 23.60% fib level [$16.85] and the 0.00% fib level [$18.54], at the time of writing.
Bullish market participants have a primary aim on AVAX of a full retracement to where AVAX’s price suffered its most recent breakdown at 0.00% [$18.54].
Conversely, bearish traders that are still short the crypto market and Avalanche specifically have targets of 23.60%, 38.20% [$15.80], 50.00% [$14.95], 61.80% [$14.11], 78.60% [$12.91], and the 100.00% fibonacci level [$11.37].

Avalanche’s 24 hour price range is $16-$17.20 and its 7 day price range is $12.08-$17.20. AVAX’s 52 week price range is $10.63-$103.58.
Avalanche’s price on this date last year was $92.25.
The average price of AVAX over the last 30 days is $12.44 and its +21.51% over the same interval.
Avalanche’s price [-0.88%] closed its daily session on Sunday worth $16.80 and in red figures for the first time in three days.


