Bitcoin Analysis
Bitcoin’s price made its highest price since September of 2022 on Tuesday but finished in red figures and -$46.8.
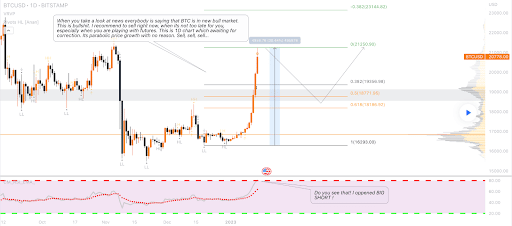
The BTC/USD 1D chart via KoDPrey is the first chart we’re observing for this Wednesday. BTC’s price is trading between the 0 fibonacci level [$21,250.90] and the -0.382 fib level [$23,144.82], at the time of writing.
The primary level of interest in the interim for bullish traders is the -0.382 fib level. Bullish traders are happy to consolidate in between the 0 fib level and -0.382 as long as BTC’s price stays above $19,891 which is BTC’s most important level of inflection.
More pessimistic market participants that are shorting BTC at this level want to firstly send BTC’s price below the 0 fibonacci level with a secondary aim of 0.382 [$21,250.90]. After the 0.382 the targets are 0.5 [$18,771.95], 0.618 [$18,186.92], and 1 fib level [$16,293.00].


Bitcoin’s Moving Averages: 5-Day [$19,716.18], 20-Day [$17,544.37], 50-Day [$17,133.89], 100-Day [$18,464.42], 200-Day [$22,826.71], Year to Date [$18,102.36].
BTC’s 24 hour price range is $20,841.3-$21,647.5 and its 7 day price range is $17,438.7-$21,647.5. Bitcoin’s 52 week price range is $15,505-$48,162.9.
The price of Bitcoin on this date in 2022 was $42,358.5.
The average price of BTC for the last 30 days is $17,509.9 and its +22.5% over the same interval.
Bitcoin’s price [-0.22%] closed its daily candle worth $21,136.8 and in negative figures for only the second time over the last ten days.
Summary
Ethereum Analysis
Ether’s price also made its highest level of the recent rally on Tuesday despite closing in negative figures by less than 1% and -$12.3.
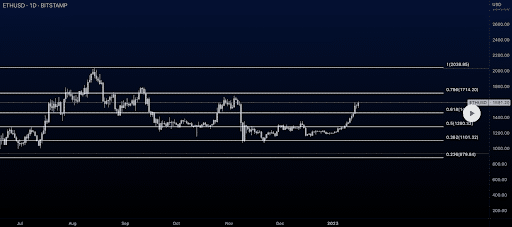
The second chart we’re analyzing for today is the ETH/USD 1D chart below by GroundNinja. At the time of writing, ETH’s price is trading between the 0.618 fib level [$1,459.34] and the 0.786 fib level [$1,714.20].
The targets to the upside on Ether are 0.786 and the 1 fibonacci level [$2,038.85].
Looking through a bearish lens we can see the targets to the downside on ETH are 0.618, 0.5 [$1,280.33], 0.382 [$1,101.32], and the 0.236 fib level [$879.84]. If bears are able to penetrate the 0.236 that will mark a fresh multi-year low on Ether on the BITSTAMP chart.

ETH’s 24 hour price range is $1,541.15-$1,609 and its 7 day price range is $1,335.14-$1,609. Ether’s 52 week price range is $883.62-$3,579.96.
Ether’s price on this date in 2022 was $3,159.96.
The average price of ETH for the last 30 days is $1,283.57 and its +24.01% during the same period.
Ether’s price [-0.78%] closed its daily candle on Tuesday worth $1,564.63 and in red figures for the first time in ten days.
Gala Analysis
Gala’s price was the outlier of the projects covered today and finished in green figures [+$0.00292] for Tuesday’s session.
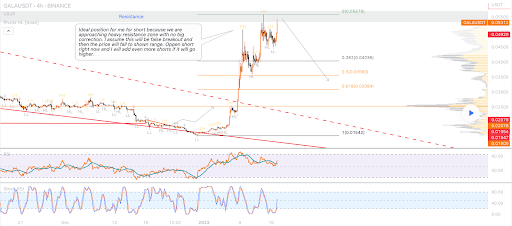
The final chart for analysis this Wednesday is the GALA/USD 4HR chart from KoDPrey. GALA is trading between the 0.382 fib level [$0.04036] and 0 [$0.04036], at the time of writing.
Traders of the bullish persuasion have reached a heavy resistance zone and are closing in on the area where Gala’s price most recently suffered a breakdown. Bullish traders need to eclipse the 0 fibonacci level to continue their ascent.
Conversely, the bearish market participants of GALA have a primary aim of 0.382 followed by targets of 0.5 [$0.03560], 0.618 [$0.03084] and the 1 fibonacci level [$0.01542].

Gala’s 24 hour price range is $0.04526-$0.05556 and its 7 day price range is $0.03830-$0.05556. Gala’s 52 week price range is $0.01551-$0.39497.
Gala’s price on this date last year was $0.30025.
The average price of GALA over the last 30 days is $0.02645 and its +112.07% over the same span.
Gala’s price [+6.25%] closed its daily candle worth $0.04962 on Tuesday and in green figures for the first time in four daily sessions.


