Summary
Bitcoin value analysis
On Wednesday Bitcoin’s value rallied during the day’s second 12HR candle after the Federal Reserve’s announcement of a quarter point interest rate hike.
Despite the increase, BTC’s price closed at its second highest level of 2023 after the news of a second consecutive meeting where The Fed’s rate increases slowed. Bullish BTC market participants reacted to that news and BTC’s price was lifted by $601.5 on Wednesday by bulls.
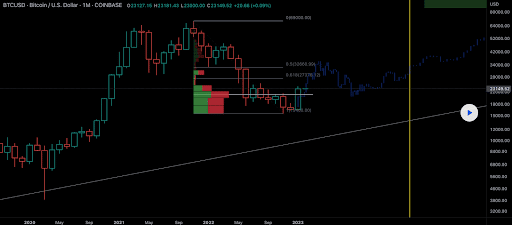
We’re beginning this Thursday with a fresh look at the BTC/USD 1M chart below from BGMind_Control. At the time of writing, BTC’s price is trading between the 1 fibonacci level [$15,460.00] and the 0.618 fib level [$27,376.12].
The overhead targets for bullish Bitcoin traders on the monthly timescale are 0.618, 0.5 [$32,660.99], and a full retracement at 0 [$69,000] to BTC’s 2021 cycle top high.
Bearish Bitcoin traders are on the opposite spectrum and aiming at firstly sending BTC’s price back down to retest the asset’s most integral level of inflection [$19,891]. If they are successful in pushing BTC’s price below that level their secondary aim is the 1 fibonacci level.
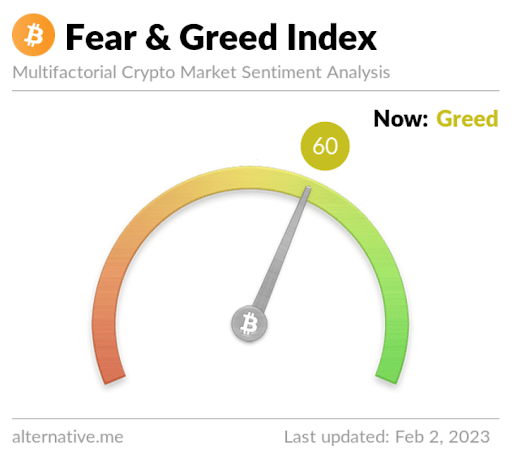
Bitcoin’s Moving Averages: 5-Day [$22,984.24], 20-Day [$20,776.80], 50-Day [$18,426.52], 100-Day [$18,733.18], 200-Day [$21,854.55], Year to Date [$20,250.55].
BTC’s 24 hour price range is $22,760.2-$23,812.7 and its 7 day price range is $22,760.2-$23,812.7. Bitcoin’s 52 week price range is $15,505-$48,12.9.
The price of Bitcoin on this date last year was $36,872.1.
The average price of BTC for the last 30 days is $20,215.3 and its +39% over the same stretch.
Bitcoin’s price [+2.60%] closed its daily candle worth $23,725.9 and in green figures for the third time over the last four days on Wednesday.
Ethereum Analysis
Ether’s price also marked-up during Wednesday’s trading session and when traders concluded for the day, ETH’s price was +$56.93.
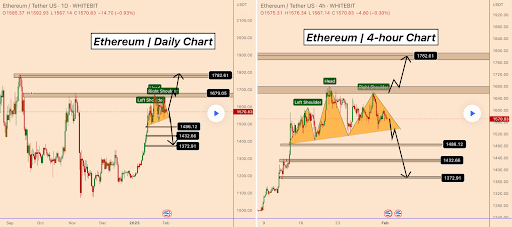
The second project we’re analyzing this Thursday is Ethereum and we’re looking at the daily chart on the left and the 4HR time frame below on the chart positioned below on the right.
KlejdiCuni believes that Ether’s price is working on a Head and Shoulders pattern on both timescales.
If the chartist is correct, the target for bearish ETH traders on the daily time frame is $1,372.91.
On the 4HR timescale the H&S pattern looks a bit scuffed and isn’t as distinguishable as on the daily time frame. However, if the pattern does play out, the target on ETH on the 4HR chart is also back down to retest the $1,372.91 level.
Ether’s Moving Averages: 5-Day [$1,584.64], 20-Day [$1,502.20], 50-Day [$1,340.57], 100-Day [$1,348.50], 200-Day [$1,521.24], Year to Date [$1,466.39].
ETH’s 24 hour price range is $1,555.18-$1,647.77 and its 7 day price range is $1,555.18-$1,647.77. Ether’s 52 week price range is $883.62-$3,579.96.
The price of ETH on this date in 2022 was $2,680.68.
The average price of ETH for the last 30 days is $1,461.42 and its +31.39% over the same interval.
Ether’s price [+3.59%] closed its daily candle on Wednesday worth $1,642.18.
Cardano Analysis
Cardano’s price climbed $0.0065 on Wednesday and is at a critical level for market participants.
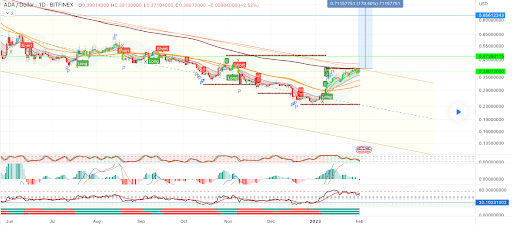
The ADA/USD 1D chart below from Maxi0070 shows ADA’s price bumping up against the upper bound of a long-term descending channel.
Bullish ADA traders need to crack the $0.4 level to break out on the daily timescale. Of course, they’ll want candle close confirmation on that time frame to signal further strength to market participants.
Conversely, bearish ADA traders want to reject bulls and retest the heartline of the daily timescale’s structure at $0.235.
Cardano’s Moving Averages: 5-Day [$23,235.37], 20-Day [$21,151.10], 50-Day [$18,583.65], 100-Day [$18,777.04], 200-Day [$21,780.71], Year to Date [$20,420.54].
Cardano’s 24 hour price range is $0.371-$0.401 and its 7 day price range is $0.371-$0.40.1. ADA’s 52 week price range is $0.239-$1.26.
Cardano’s price on this date last year was $1.02.
The average price of ADA over the last 30 days is $0.333 and its +61.43% over the same duration.
Cardano’s price [+1.67%] closed its daily candle on Wednesday worth $0.396 and in positive figures for the second straight day.


