


In this article we will see the analysis of three crypto and so their performances: Bitcoin, Ethereum and Polygon (Matic).
Summary
Bitcoin crypto Analysis
Bearish Bitcoin market participants sent the asset’s price backwards for the fifth consecutive day on Monday and when the day’s candle had wrapped, BTC’s price was -$181.
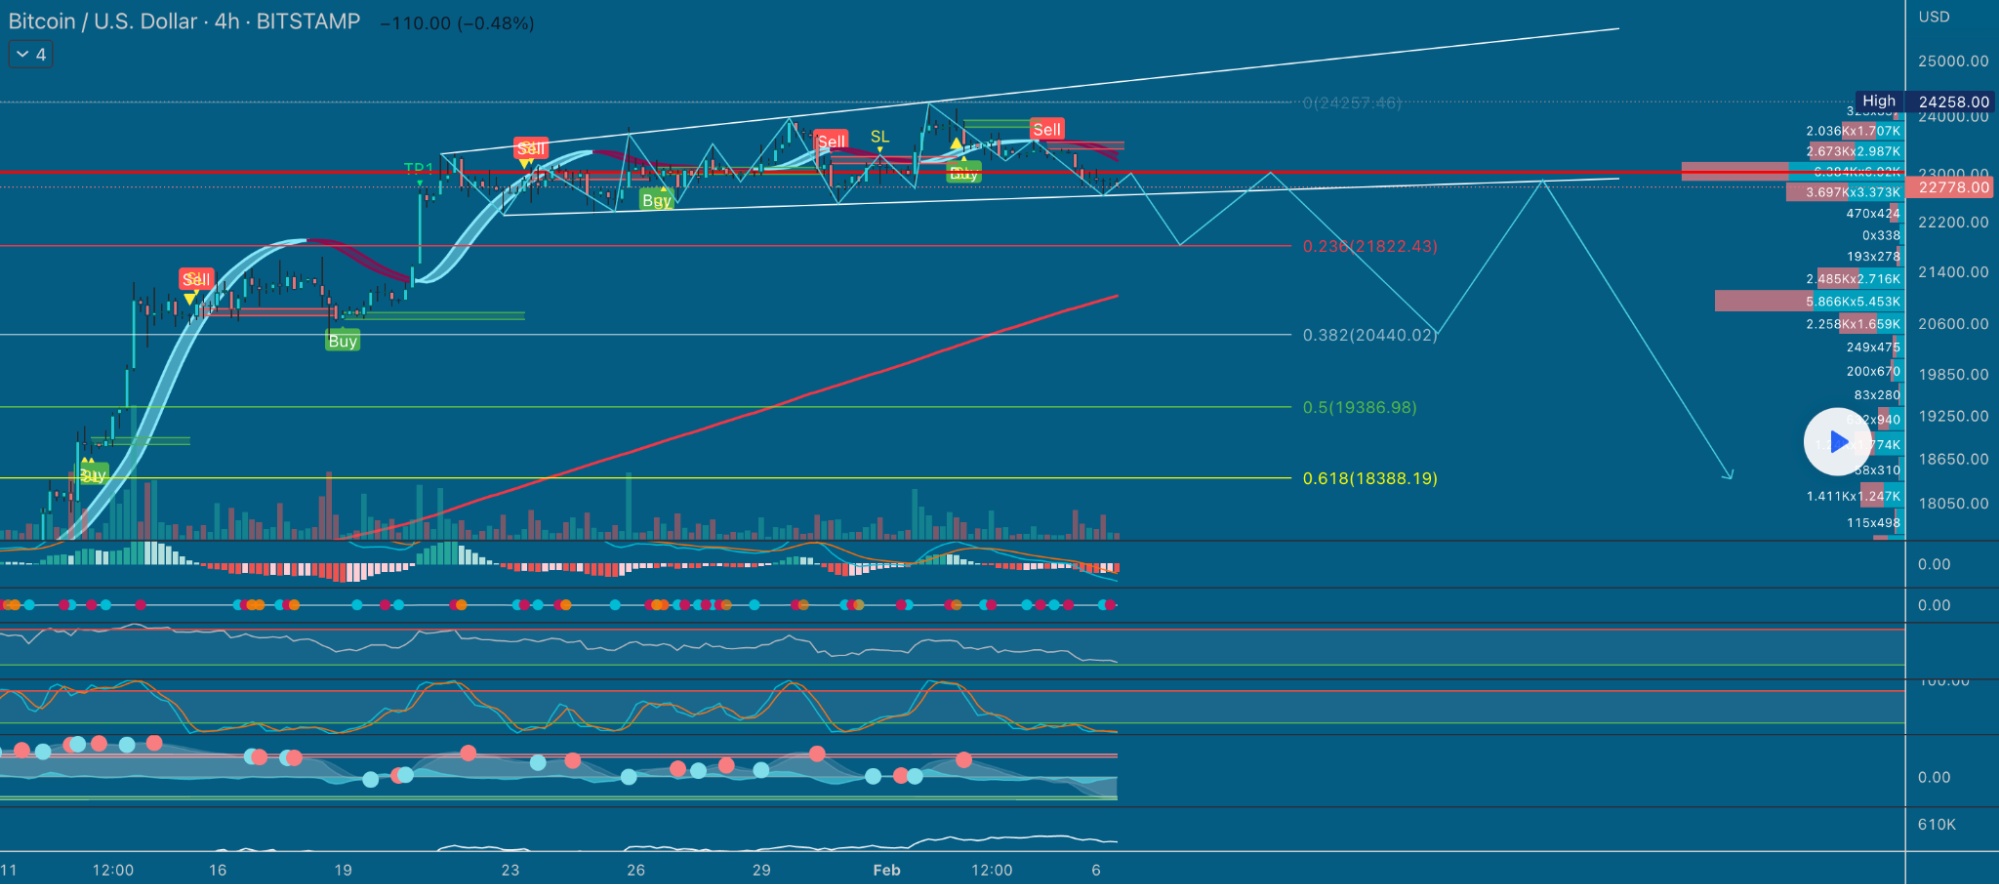
The BTC/USD 4HR chart via ankhramsiswmriimn is the first chart for analysis this Tuesday. At the time of writing, BTC’s price is trading between the 0.236 fibonacci level [$21,822.43] and the 0 fib level [$24,257.46].
Bulls obviously want to continue their ascent but are currently trading within an Ascending Broadening Wedge pattern that probabilistically breaks out to the downside in the majority of cases. To avoid a short-term pullback bulls want to retest their recent high at the 0 fib level and break the upper bound of the 4HR time frame.
Conversely, bearish BTC crypto market participants have targets to the downside of 0.236, 0.382 [$20,440.02], 0.5 [$19,386.98], and the 0.618 fibonacci level [$18,388.19].
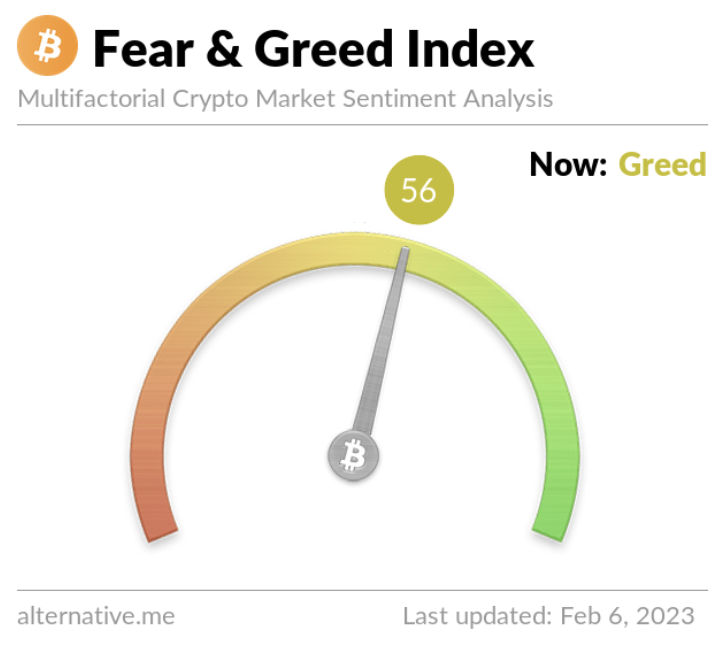
The Fear and Greed Index is 56 Greed and is -2 from Monday’s reading of 58 Greed.
Bitcoin’s Moving Averages: 5-Day [$23,331.00], 20-Day [$21,761.78], 50-Day [$18,848.93], 100-Day [$18,844.31], 200-Day [$21,619.96], Year to Date [$20,631.28].
BTC’s 24 hour price range is $22,620-$23,145 and its 7 day price range is $22,620-$23,723. Bitcoin’s 52 week price range is $15,505-$48,162.9.
The price of bitcoin on this date last year was $43,825.7.
The average price of BTC for the last 30 days is $21,228.7 and its +36.7% over the same stretch.
Bitcoin’s price [-0.74%] closed its daily candle worth $22,755 on Monday.
Ethereum crypto Analysis
Bearish traders again controlled ETH’s price on Monday for a second day in a row and when the day’s candle was painted, ETH’s price was -$15.74.
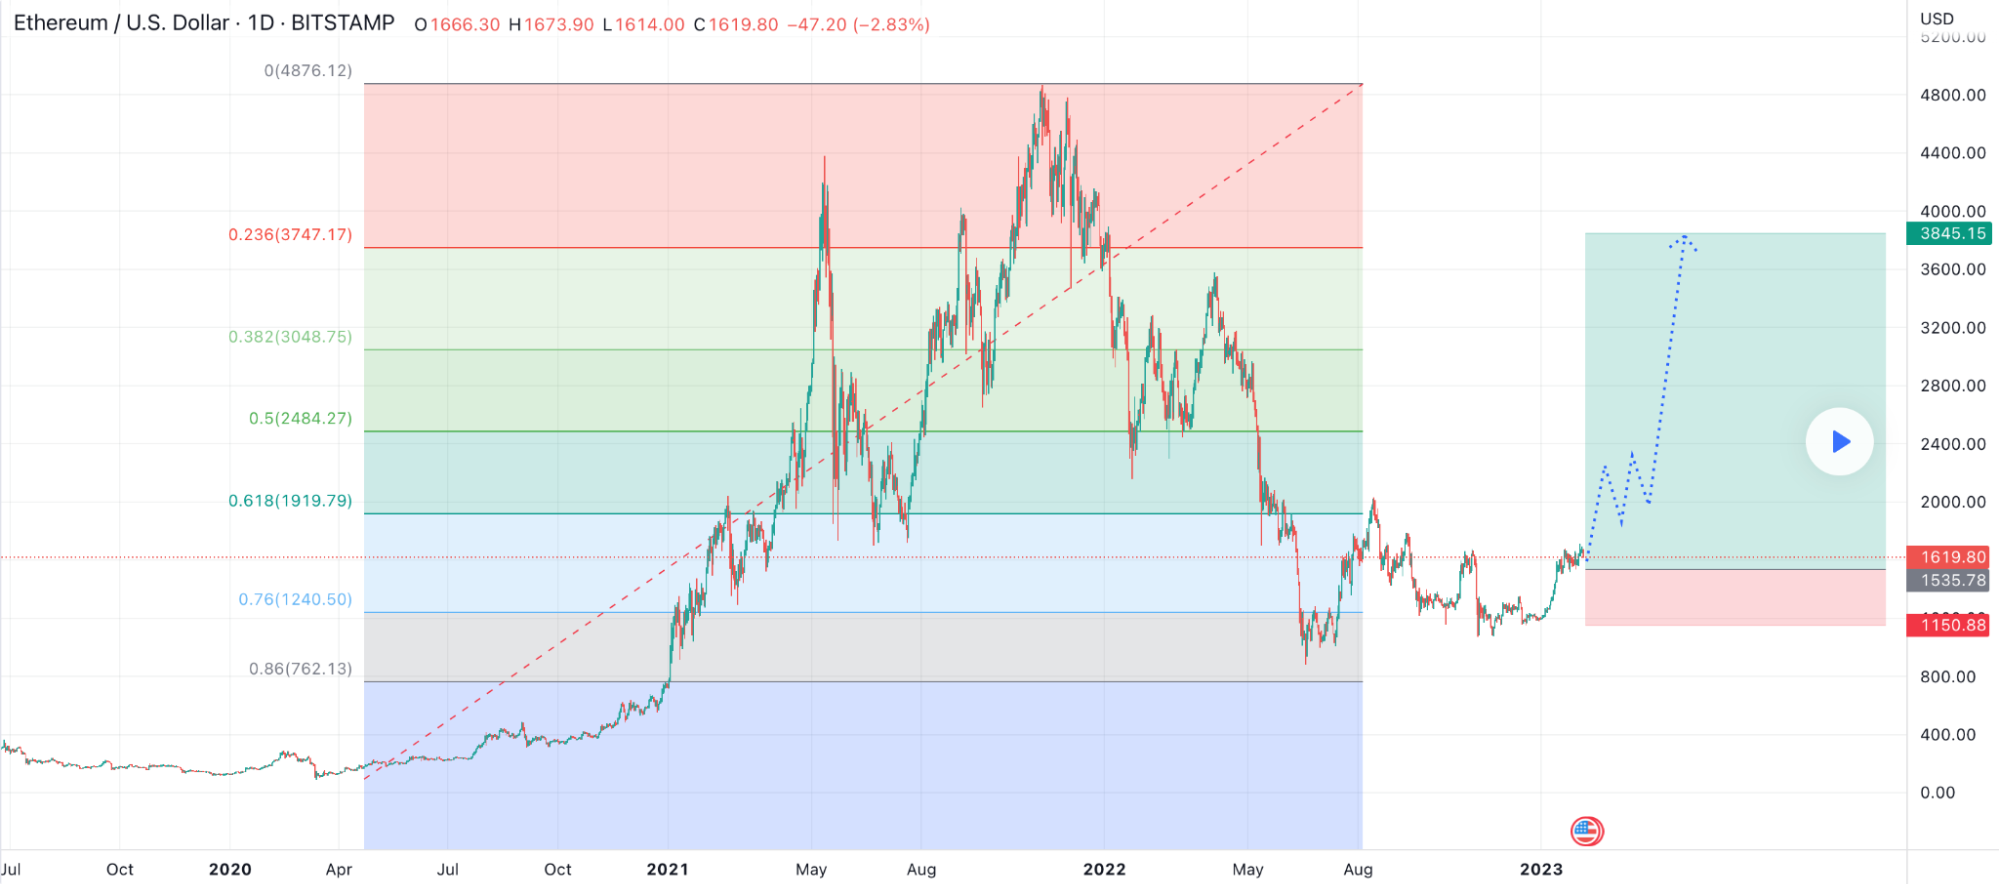
The second chart we’re examining today is the ETH/USD 1D chart below by holeyprofit. ETH’s price is trading between the 0.76 fibonacci level [$1,240.50] and the 0.618 fib level [$1,919.79], at the time of writing.
Traders of Ether’s market that are expecting further upside on ETH have to hold the 0.76 as support and continue their climb. Their targets above on ETH are 0.618 [$1,919.79], 0.5 [$2,484.27], 0.382 [$3,048.75], 0.236 [$3,747.17], and full retrace at 0 [$4,876.12] which is Ether’s all-time high from 2021 on BITSTAMP.
At variance with bulls are bearish Ether traders that want to push ETH’s price below the 0.76 fib level again. They’ve a secondary aim on ETH of 0.86 which is the 12-month and bear market low on BITSTAMP.
Ether’s Moving Averages: 5-Day [$1,632.61], 20-Day [$1,560.33], 50-Day [$1,369.26], 100-Day [$1,353.04], 200-Day [$1,503.14], Year to Date [$1,489.46].
ETH’s 24 hour price range is $1,605.01-$1,658.56 and its 7 day price range is $1,585.25-$1,666.92. Ether’s 52 week price range is $883.62-$3,579.96.
The price of ETH on this date last year was $3,139.68.
The average price of ETH for the last 30 days is $1,528.97 and its +30.76% over the same period.
Ether’s price [-0.97%] closed its daily candle on Monday worth $1,613.71.
Maticc crypto analysis
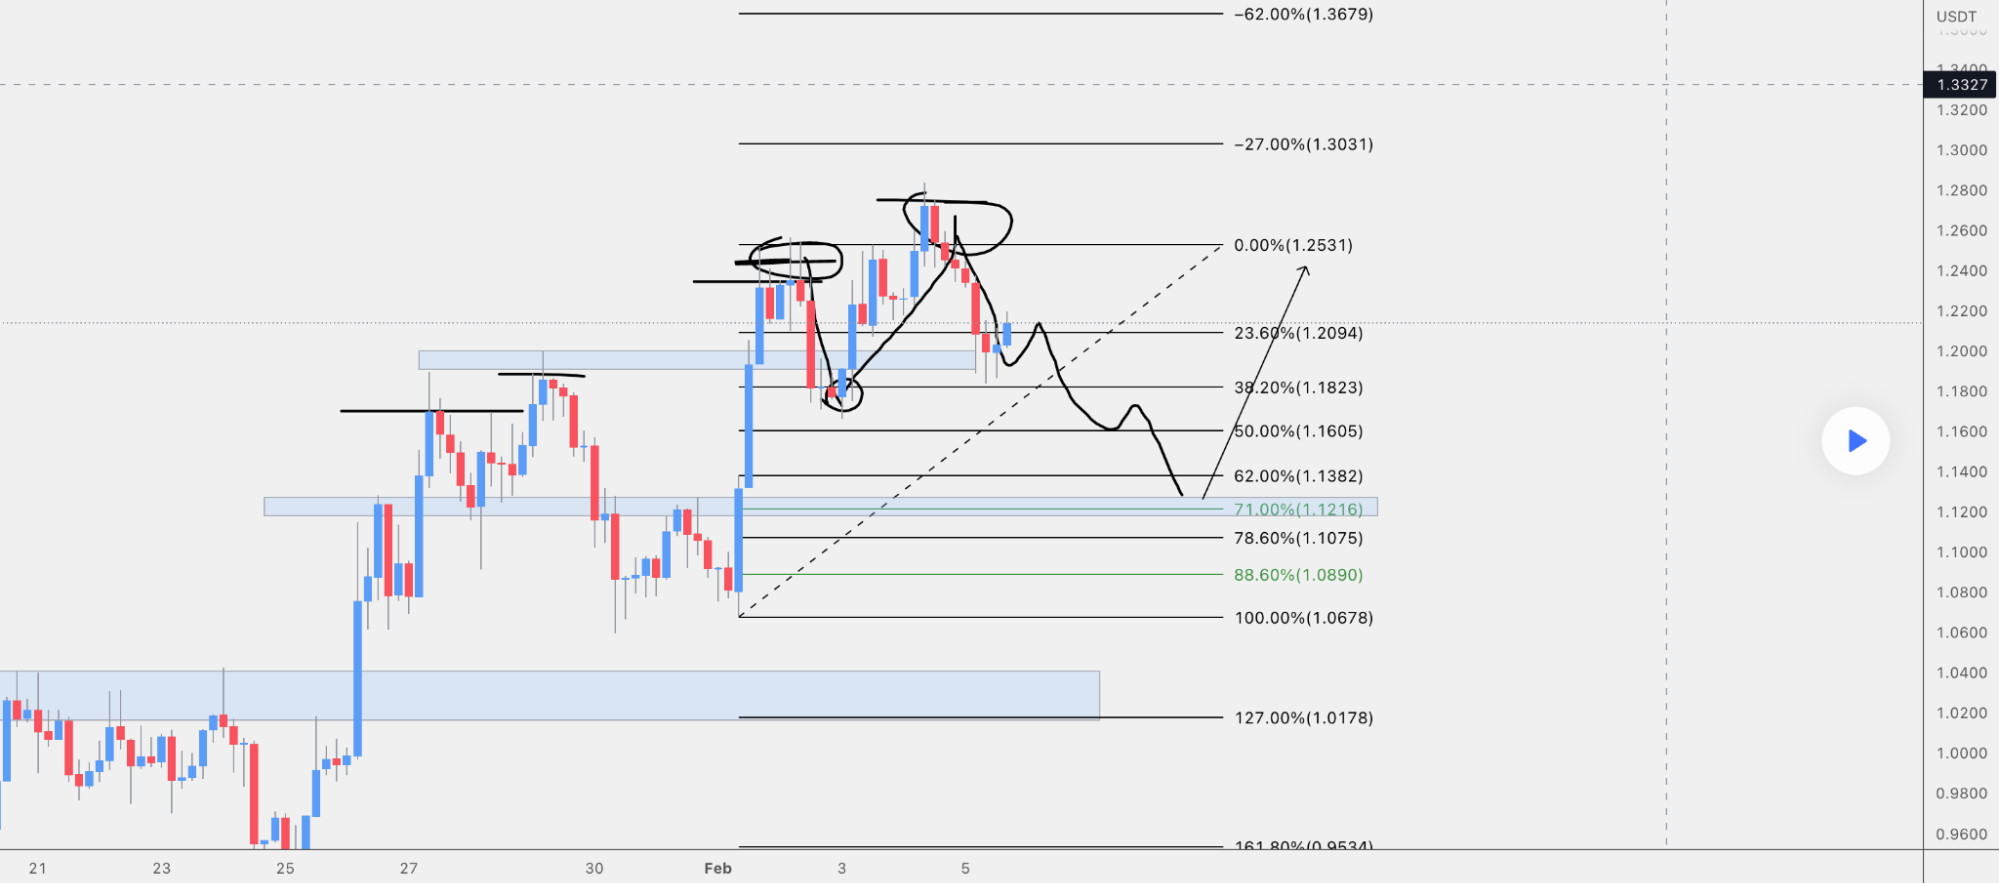
The MATIC/USD 4HR chart below from camilomendezp is the chart we’re wrapping up with today. At the time of writing, MATIC’s price is trading between the 38.20% fibonacci level [$1.1823] and the 23.60% fib level [$1.2094].
The levels to control overhead for bullish MATIC traders are 23.60%, 0.00% [$1.2531], -27.00% [$1.3031], and the -62.00% fib level [$1.3679].
Contrariwise, bearish traders want to control these levels 38.20%, 50.00% [$1.1605], 62.00% [$1.13.82], 71.00% [$1.1216], 78.60% [$1.1075], 88.60% [$1.0890], 100.00% [$1.0678], and the 127.00% fib level [$1.0678].
Polygon’s Moving Averages: 5-Day [$1.18], 20-Day [$1.03], 50-Day [$0.919], 100-Day [$0.891], 200-Day [$0.813], Year to Date [$0.981].
Polygon’s 24 hour price range is $1.17-$1.23 and its 7 day price range is $1.10-$1.24. MATIC’s 52 week price range is $0.317-$2.05.
Polygon’s crypto price on this date last year was $2.01.
The average price of MATIC over the last 30 days is $1.02 and its +50.98% over the same stretch.
Polygon’s crypto price [-0.98%] closed its daily session on Sunday worth $1.19.


.)