

The bear market of 2022 has been brutal for the entire digital asset industry, with prices drawing down over 75% from the ATH for both BTC and ETH. In this piece, we take a big picture view of the big events and trends from an on-chain data perspective.
Summary
Bitcoin
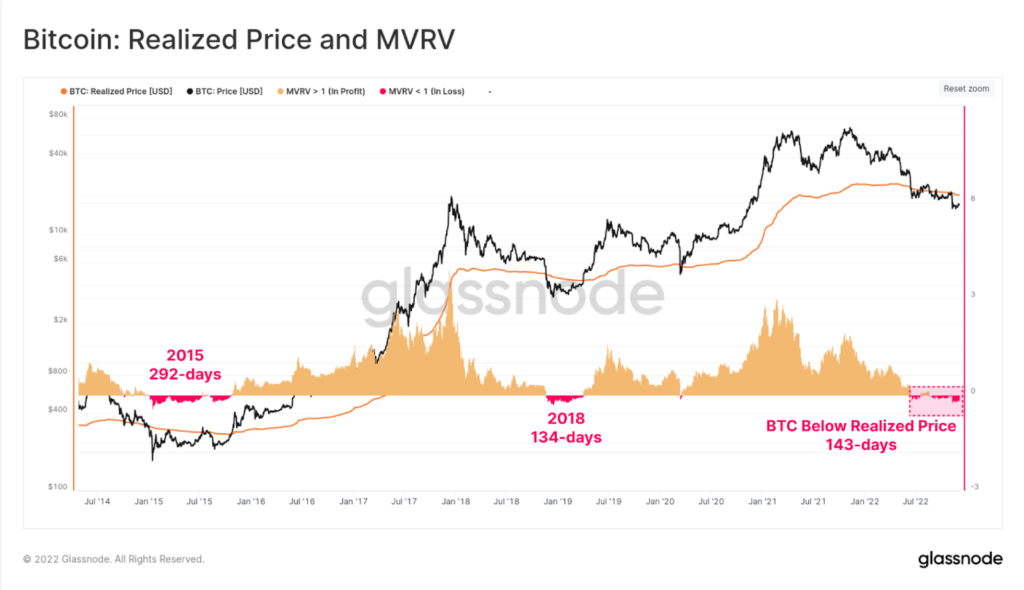
Bitcoin spot prices fell below the Realized Price (currently ~$20k) in mid-June, which is often considered the aggregate cost basis of the market. This indicates that the average BTC investor is underwater on their holdings, and has been for 143-days so far. Both in scale and duration, this is now on par with prior bear markets.
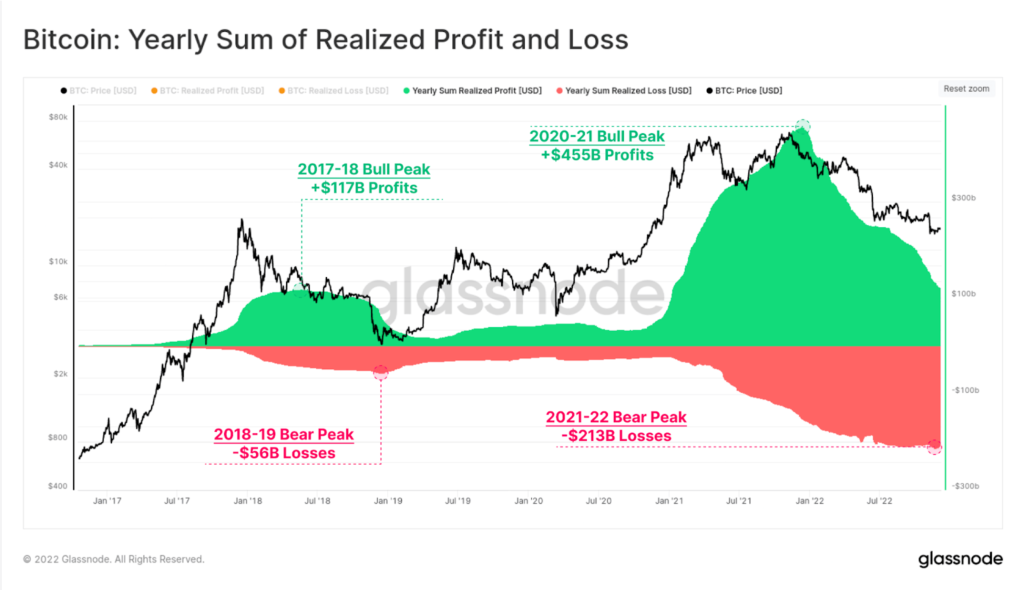
We can assess the rolling yearly sum of realized profit and loss. Here we can see that the 2022 bear has resulted in over -$213B in realized losses, indicating the market has given back 46.8% of the $455B in profits taken in 2020-21. Most of it followed the failures of LUNA, 3AC and FTX.
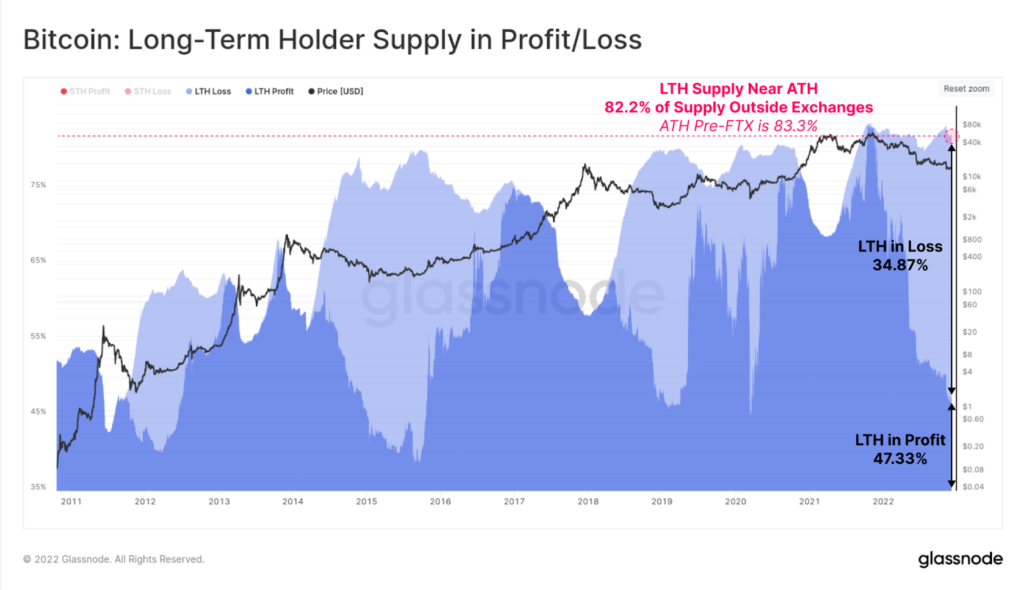
However, even with the prevailing bearish trend in play, the proportion of BTC supply held by Long-term holders (LTHs) is near all-time highs. In the wake of the FTX collapse, LTH supply declined by just 1.3%, which suggests that HODLer conviction remains remarkably intact. LTHs currently hold 82.2% of the supply, with 34.87% of it held at an unrealized loss.
Ethereum
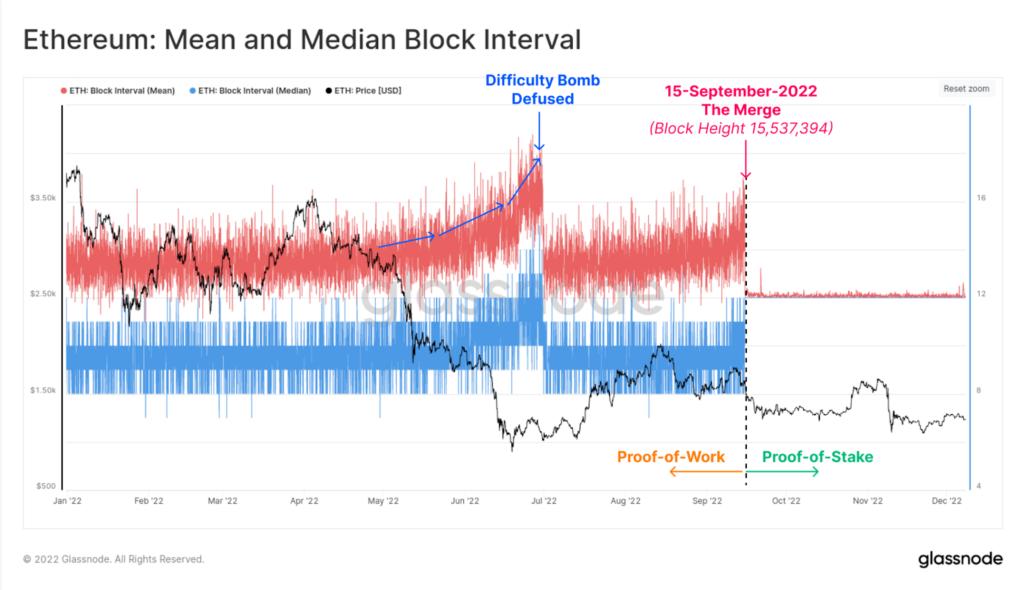
For Ethereum, there was a brief moment of bear market relief, as The Merge took place on 15-September. This chart presents the mean and median block interval throughout 2022. We can clearly see where the probabilistic, and naturally variable PoW mining came to an end, and switched over to the consistent 12-second blocktime of PoS. Also notable is the activation and defusing of the fifth and final difficulty bomb in June.
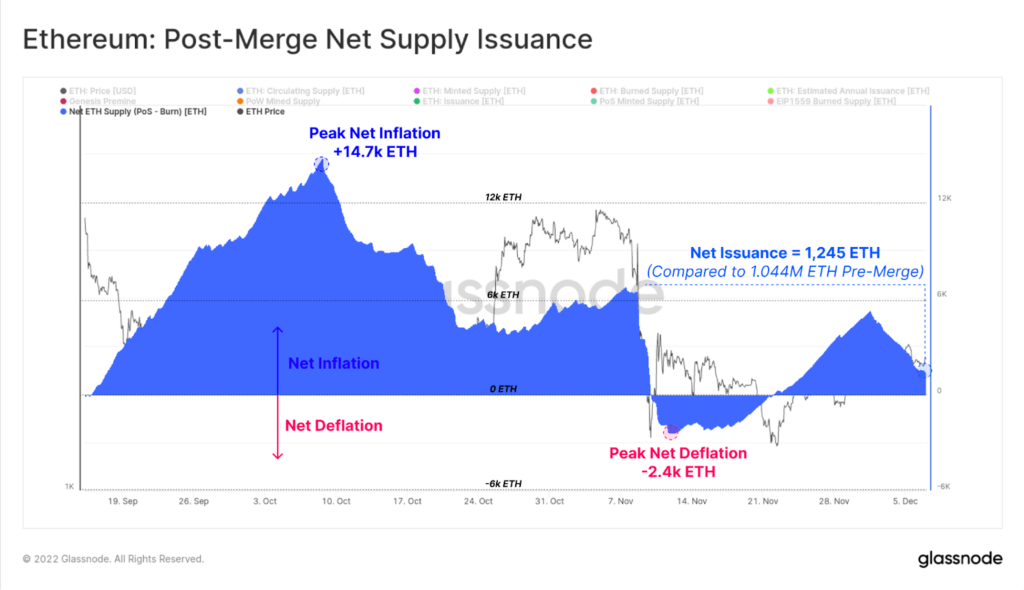
With the Merge came a significant drop in the ETH issuance rate, falling to around 0.5% per year on a nominal basis. However with EIP1559, much of the new supply is offset by a burn mechanism, resulting in just 1,245 new ETH entering circulation since. This compares to approximately 1.04M ETH that would have been issued under the previous monetary policy.
Stablecoins
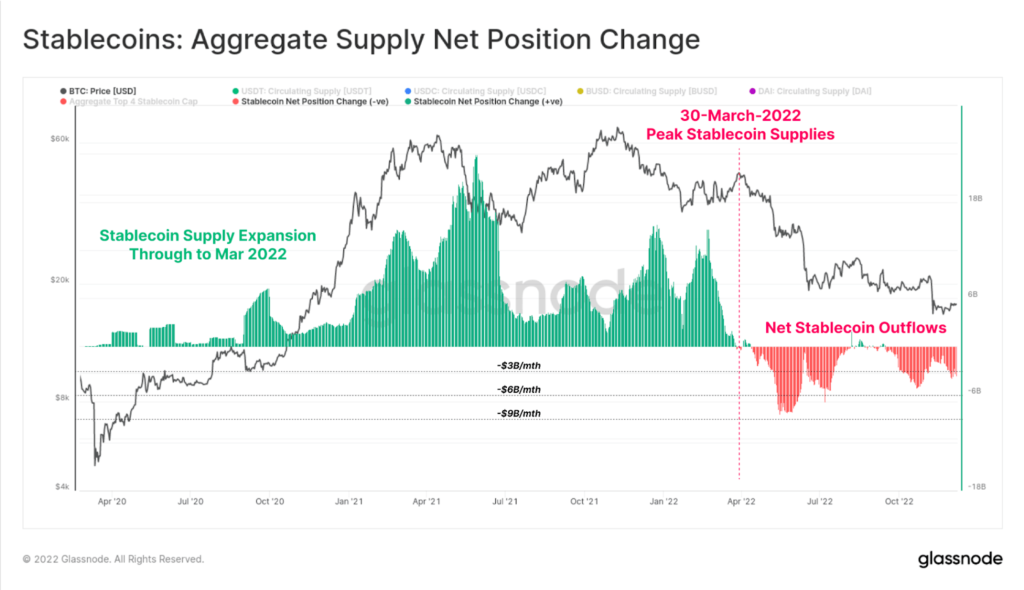
Stablecoins have become a cornerstone asset of the industry since 2020, with 3 of the top 6 assets by market cap being stablecoins. Total stablecoin supply peaked at $161.5B in March 2022, however has since seen large scale redemptions of over $14.3B.
Like realized losses, this reflects net capital outflows from the space, however is also just 8% of the peak, suggesting a majority of capital remains.
With 2022 drawing to a close, we can assess the large scale trends occurring in on-chain data. The majority of the year has been dominated by bearish sentiment, capital outflows, and several high profile failures of centralized entities.
The result is Bitcoin and Ether trading below their respective Realized Prices, $14.3B in stablecoin outflows, and 75% price drawdowns for BTC and ETH.
Despite this however, Bitcoin HODLers remain remarkably high in their conviction, and Ethereum successfully completed the long awaited engineering feat of The Merge.