

After a weak stretch, the Solana price is trading near $88.3 and testing a key inflection point, with short-term momentum improving while the broader market structure remains fragile.
Summary
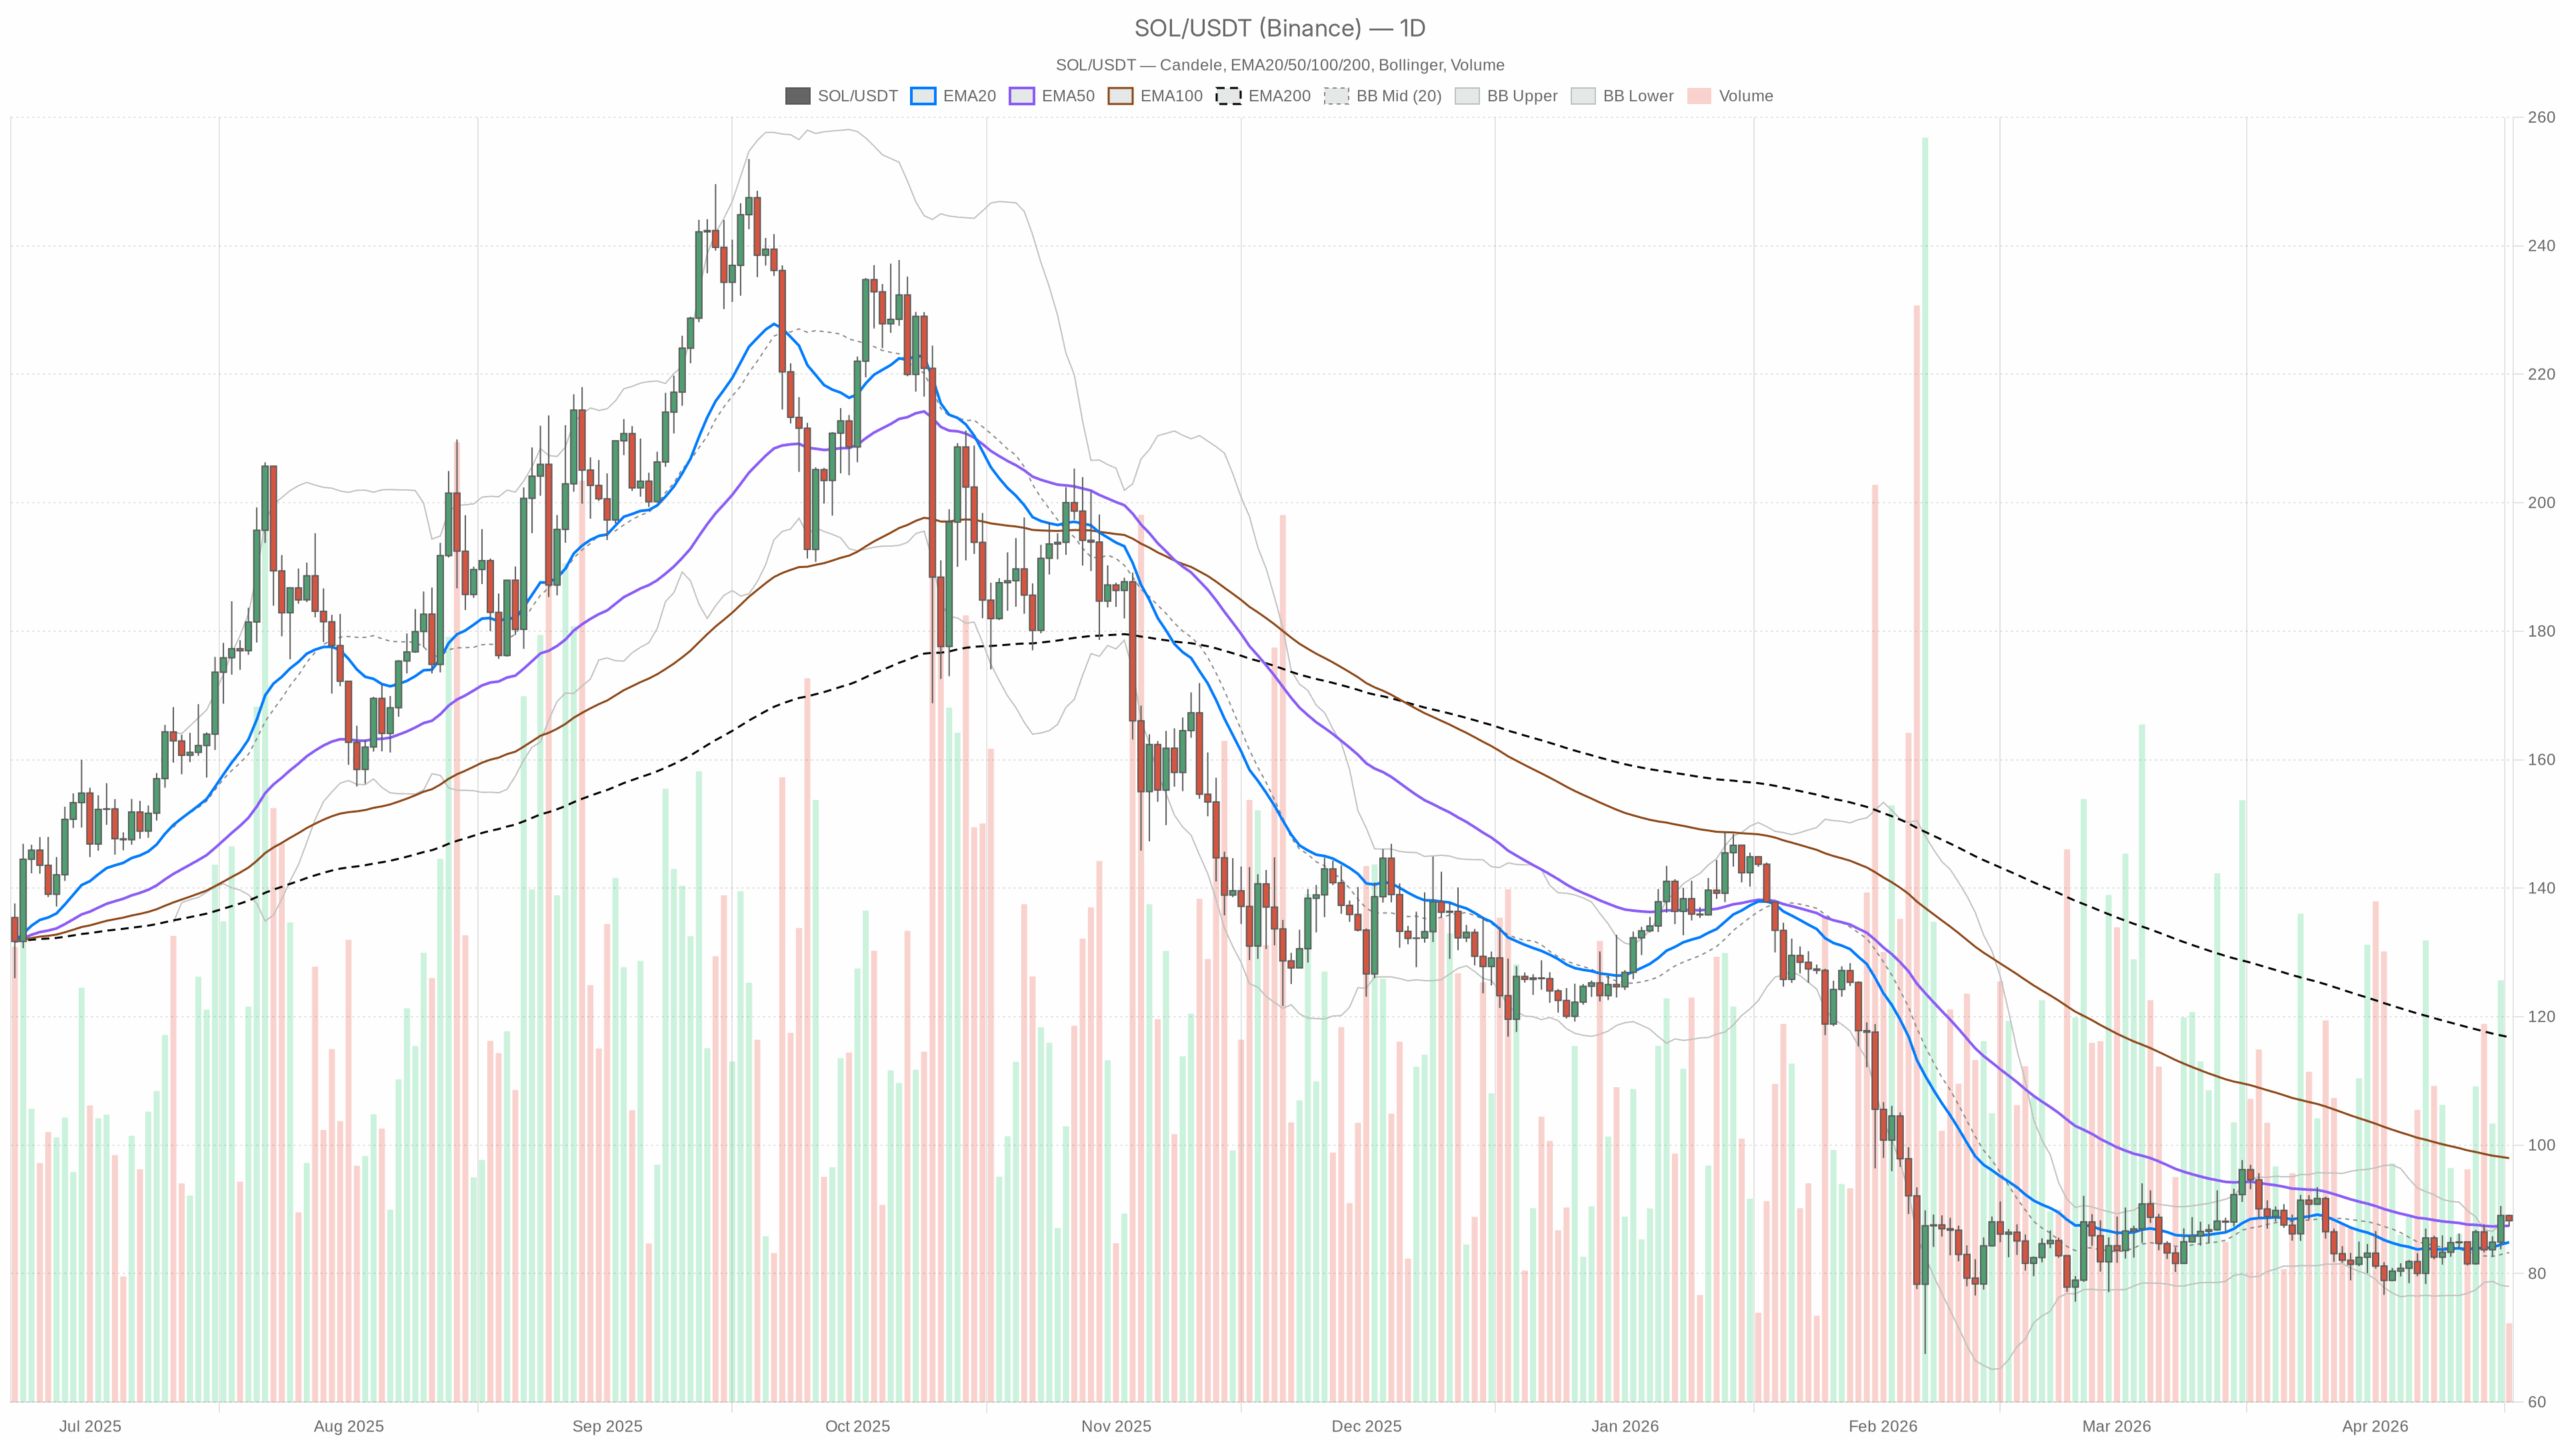
Constructive rebound on the daily chart, but no full trend repair yet
The daily timeframe still defines the macro bias, and for now it looks neutral with a bullish tilt. SOL closed at $88.24, above the 20-day EMA at $84.89 and the 50-day EMA at $87.44. That is a meaningful improvement because buyers have regained control of the recent swing range.
However, the 200-day EMA at $116.80 remains far above price. That level still separates a tactical rebound from a broader bullish trend. Until SOL starts reclaiming that region, long-term sellers still have a valid case.
The daily RSI is 55.51, which puts momentum on the positive side without showing overheating. That usually fits a market that is recovering rather than breaking out. Moreover, the daily MACD also supports that reading.
The MACD line stands at 0.20, versus a signal line at -0.64, with a positive histogram of 0.84. Momentum has turned higher, but it is still early to say whether this move can become sustained or remain range-bound.
Bollinger Bands add another layer. The middle band sits at $83.28, while the upper band is at $88.55. Price is pressing near that upper boundary, which suggests upside could become harder unless buyers force a clean expansion through resistance.
Daily ATR comes in at 4.06, a reminder that SOL still carries meaningful swing volatility. In addition, the daily pivot is $88.26, with resistance at $89.17 and support at $87.34. Since price is hovering around the pivot, the market is deciding whether this rebound can extend or stall.
Hourly structure still supports buyers, even as momentum cools
The 1-hour chart still supports the bullish case from a structural standpoint. SOL is trading at $88.31, above the 20-hour EMA at $87.66, the 50-hour EMA at $86.48, and the 200-hour EMA at $84.44. That alignment keeps the short-term uptrend intact.
At the same time, hourly momentum is not as clean as the moving averages suggest. RSI is 59, which is constructive but not especially strong. Meanwhile, MACD is beginning to soften, with the line at 0.63 below the signal line at 0.78 and a slightly negative histogram of -0.15.
That usually points to slowing upside momentum rather than an outright reversal. In plain terms, the rally is still standing, but it has lost some of its intraday urgency. However, the trend remains constructive as long as buyers defend the faster moving averages.
The hourly Bollinger Bands run from $85.16 to $90.60, with a midline at $87.88. Price is above the midpoint but not pressing the upper band aggressively. That fits a market trending modestly rather than accelerating.
Hourly ATR is 0.76, so traders should still expect frequent but manageable intraday swings. The hourly pivot is $88.30, with resistance at $88.48 and support at $88.12. Therefore, the immediate battle is clear: hold above the pivot and buyers can keep probing higher.
15-minute chart is about execution and still leans upward
The 15-minute chart does not decide the bigger trend, but it helps show how price is behaving near the local range edge. SOL is trading at $88.33, above the 20-period EMA at $88.03, the 50-period EMA at $87.94, and the 200-period EMA at $86.49.
That keeps microstructure tilted toward buyers. RSI stands at 56.89, while MACD is slightly positive, with the line at 0.00 above the signal line at -0.08 and a histogram at 0.08. That is a mild tailwind, not a strong impulse.
Bollinger Bands are tight here, between $87.36 and $88.44, and price is already near the top end. That usually means the market is preparing for either a modest breakout attempt or a short-term pause. Moreover, ATR is 0.29, confirming smaller but still active execution-level volatility.
The 15-minute pivot is $88.30, with resistance at $88.50 and support at $88.14. That leaves the market coiling around a trigger zone. As a result, the next move may depend on whether price can gain acceptance above this cluster.
Indicator breakdown
RSI: The daily reading at 55.51 shows momentum has improved, but not enough to call the market overstretched. Hourly RSI at 59 and 15-minute RSI at 56.89 support that same view.
MACD: The daily MACD remains bullish, while the hourly MACD is fading slightly and the 15-minute MACD stays mildly constructive. Therefore, the broader rebound remains intact, even though short-term momentum is cooling.
EMA structure: On the daily chart, SOL is above the 20-day and 50-day EMAs, but still below the 200-day EMA. On the 1-hour and 15-minute charts, price is above all major EMAs, keeping short-term structure bullish.
Bollinger Bands: On the daily chart, price is near the upper band at $88.55. On lower timeframes, SOL is also trading in the upper half of the range. That suggests buyers remain in control, though upside now needs fresh participation.
ATR: Daily ATR at 4.06 shows SOL remains a volatile swing asset. Hourly ATR at 0.76 and 15-minute ATR at 0.29 show intraday movement is still active, though more contained.
Pivot levels: Daily pivot is $88.26, hourly pivot is $88.30, and the 15-minute pivot is also $88.30. Because price is sitting almost exactly on those levels, the market looks balanced and close to a decision point.
Bullish scenario
The bullish case is straightforward. SOL holds above the $88.25-$88.30 pivot zone, absorbs local selling pressure, and pushes through the resistance band between roughly $88.50 and $89.20. If that happens, buyers would show the recovery still has room to extend.
That setup would weaken if SOL slips back below $87.34 on the daily structure or loses hourly trend alignment by falling under the 20-hour and 50-hour EMAs. Invalidation becomes clearer if price loses the pivot cluster and cannot reclaim it quickly.
Bearish scenario
The bearish case rests on a common pattern in weak macro environments. A short-covering recovery runs into resistance and fails before the larger trend is repaired. Since SOL is already near the upper daily Bollinger Band and still far below the 200-day EMA, sellers can still argue this is only a rebound inside a broader downtrend.
If price rejects around $88.50-$89.20 and falls back below $88.00, the market could rotate lower toward $87.34 first. After that, it could revisit the mid-band area near $83.28 if selling accelerates. However, this bearish view loses credibility if buyers gain acceptance above nearby resistance.
Positioning and risk
Right now, the Solana price is in a tradable recovery, but not in a fully trusted long-term uptrend. That distinction matters. The daily chart has improved enough to support a neutral-to-bullish stance, yet the large gap below the 200-day EMA keeps the bigger trend under pressure.
Moreover, lower timeframes are still backing the rebound, but they are not showing the kind of momentum burst that usually drives clean continuation. Bitcoin dominance remains elevated, and sentiment across crypto is still in extreme fear territory, which can limit follow-through in altcoins.
For market participants, flexibility matters more than conviction here. If SOL can hold above the pivot cluster and build above resistance, the bullish case strengthens quickly. If it loses that area and momentum turns lower, this may start to look like another failed rally. In that context, the current Solana price setup remains constructive in the short term, but the broader trend still demands caution.
In summary, SOL has reclaimed enough short-term structure to keep the rebound alive, but the bigger picture is still incomplete. As of 2025, the market remains balanced near key pivots, and the next decisive move should come from acceptance above resistance or a failure back into consolidation.