

Ethereum Fails to Hold $2,400 as Resistance Caps Upside
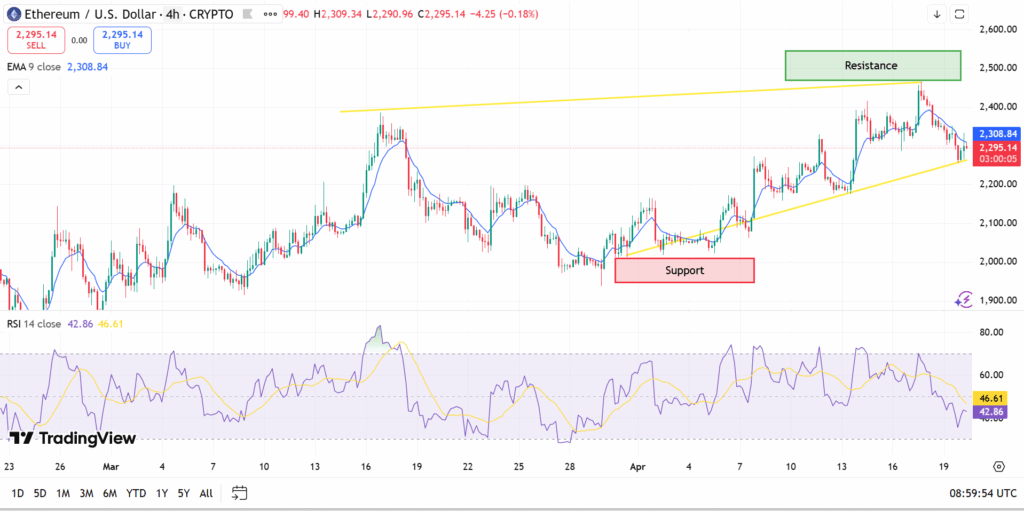
Ethereum continues to be in the spotlight since the coin did not manage to sustain its upward move beyond the $2,400 resistance level. From analysis, the coin was rejected several times in the proximity of the upper limit of its ascending trend channel, pointing to significant selling pressure.
Summary
According to data, following rejection, Ethereum was seen oscillating near $2,250-$2,300. It corresponds to short-term dynamic support such as the 9-period exponential moving average. Although the coin managed to sustain a higher low formation, a breakout above the resistance was not achieved, pointing to weak bullish momentum.
Additional evidence of resistance around $2,400 has been provided by a market analyst on X. According to his comments, breaking below the level in question would increase the bearish outlook.
This comes in light of recent market movements associated with increased geopolitical risks, which affected other risky assets like cryptocurrencies.
$2,150–$2,200 Emerges as Key Support Zone
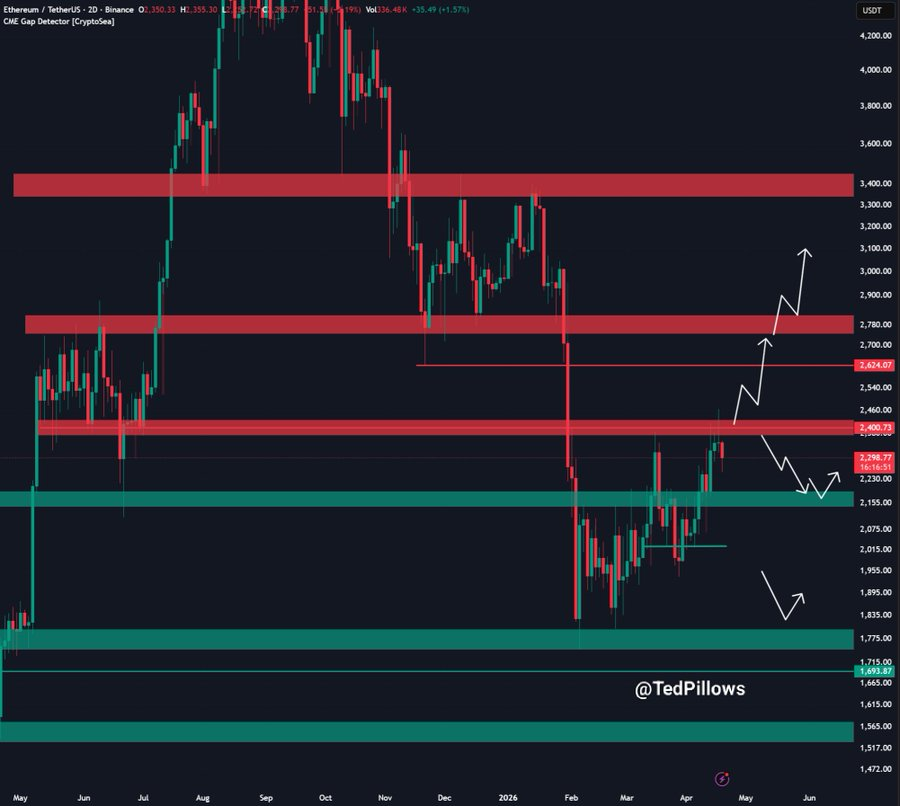
Now, Ethereum is focused on $2,150-$2,200, which has become a crucial point in the present structure. It aligns with the prior consolidation and constitutes an area where previously buyers used to enter into the market.
Should Ethereum retain support above this range, the overall upward trend will persist, permitting a retest of the resistance level at $2,400. Otherwise, a breach below this range can lead to additional bearish movements towards the psychologically important support level at $2,000.
In terms of technical analysis, price is now challenging the lower side of its ascending channel. Once price breaks below this trend line, the new market structure will turn from higher lows to lower lows.
On-Chain Data Signals Declining Network Activity
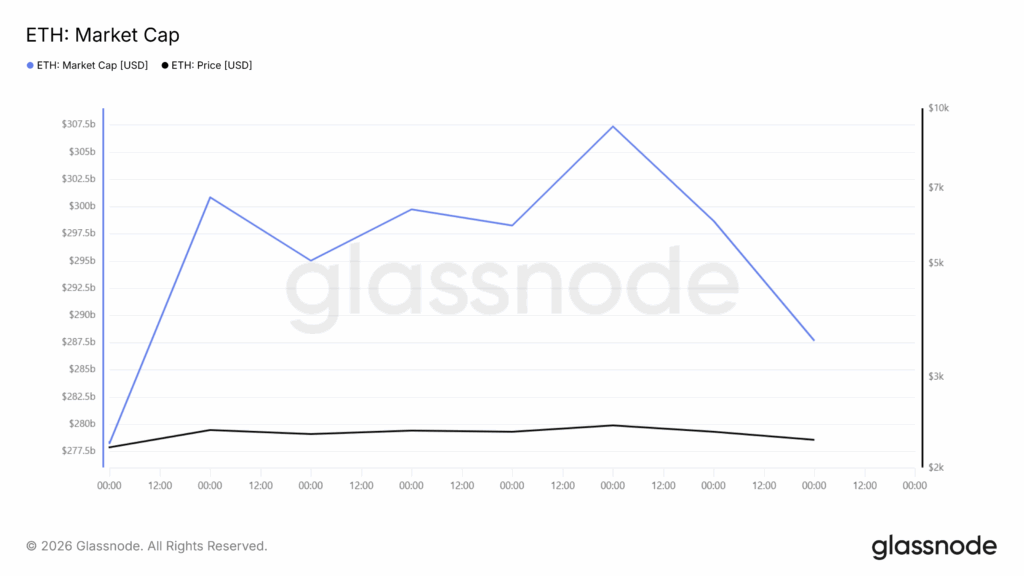
Another contributing factor in predicting the price of ethereum is on-chain indicators provided by Glassnode, indicating a drop in general activity on the network. In terms of the market cap indicator, there has been a negative movement since a recent top.
Furthermore, the indicator showing the number of active addresses shows a significant decline in network users during the considered time interval. It is known that low demand usually leads to instability of the asset’s price dynamics.
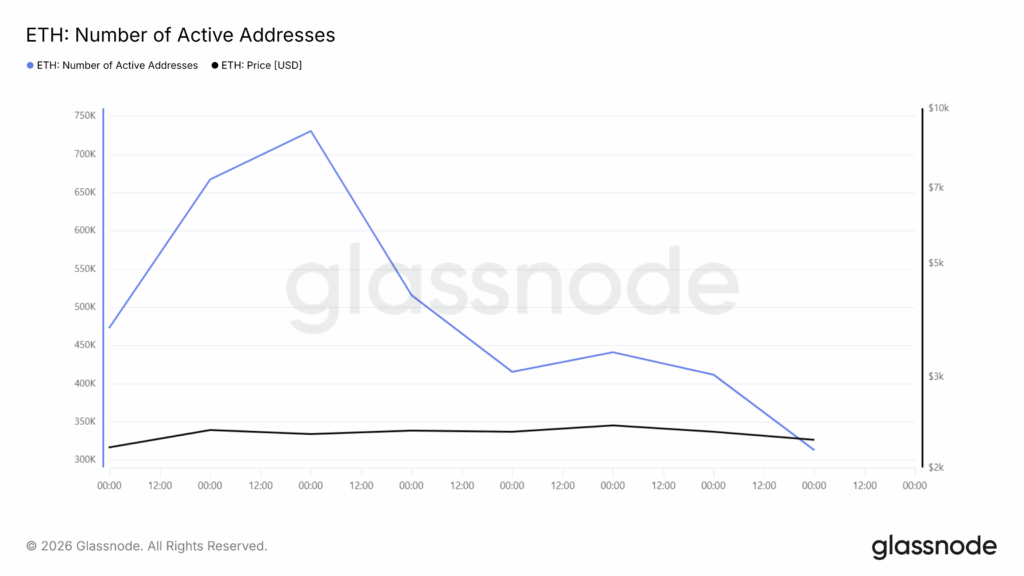
Finally, the indicator related to transactions shows that network activity has decreased. It follows that a decrease in market capitalization, the number of users, and transactions indicates weak underlying demand.
Momentum Indicators Show Weakening Buying Pressure
The technical indicators will help understand the existing analysis regarding the prediction of the current price of Ethereum. According to the Relative Strength Index, the present value of the RSI is located within the 40 middle level range. Therefore, the present trend is considered to be neutral or slightly bearish.
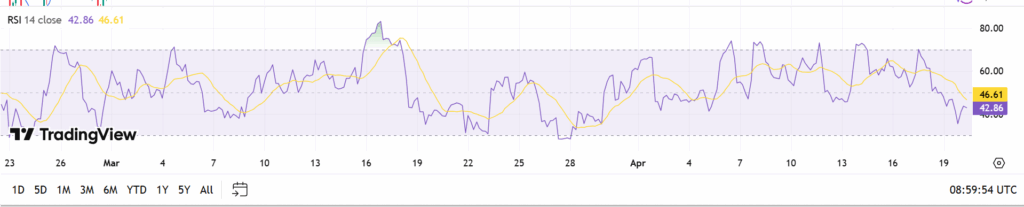
The downtrend of the RSI indicates that the buyers’ interest is waning. Besides, there are no indications of bullish divergence. It coincides with the rejection of prices from the level of resistance.
Thus, the combination of a waning trend and the rejection of prices from the resistance level implies a correction toward support levels.
Macro Conditions Add Pressure to Risk Assets
The forecast for the Ethereum price is also affected by the macroeconomic environment, including geopolitical events. The growing hostilities between the U.S. and Iran have resulted in an overall risk-off sentiment in the markets.
Digital currencies are considered to be risk-on assets and usually face selling pressure during geopolitical unrest. This has become another external driver that impacts the price dynamics, along with the prevailing technical and on-chain indicators for Ethereum.
Even though macro drivers could quickly change, their impact on market sentiment is one of the essential variables.
Ethereum Price Prediction Outlook
Ethereum price forecast shows that we have reached an important stage where the price is trading above important support but still facing important resistance. We need to keep an eye on the $2,150-$2,200 region as whether this will be broken or not will decide what happens next.
Breaking above $2,400 can help resume the upward trend and move towards important resistance zones, while a break below major support can take the price towards $2,000.