For now, the Ethereum price remains above daily trend support, but mixed momentum still argues for patience near the 2315-2320 equilibrium zone.
Summary
Main scenario: Neutral on the daily chart
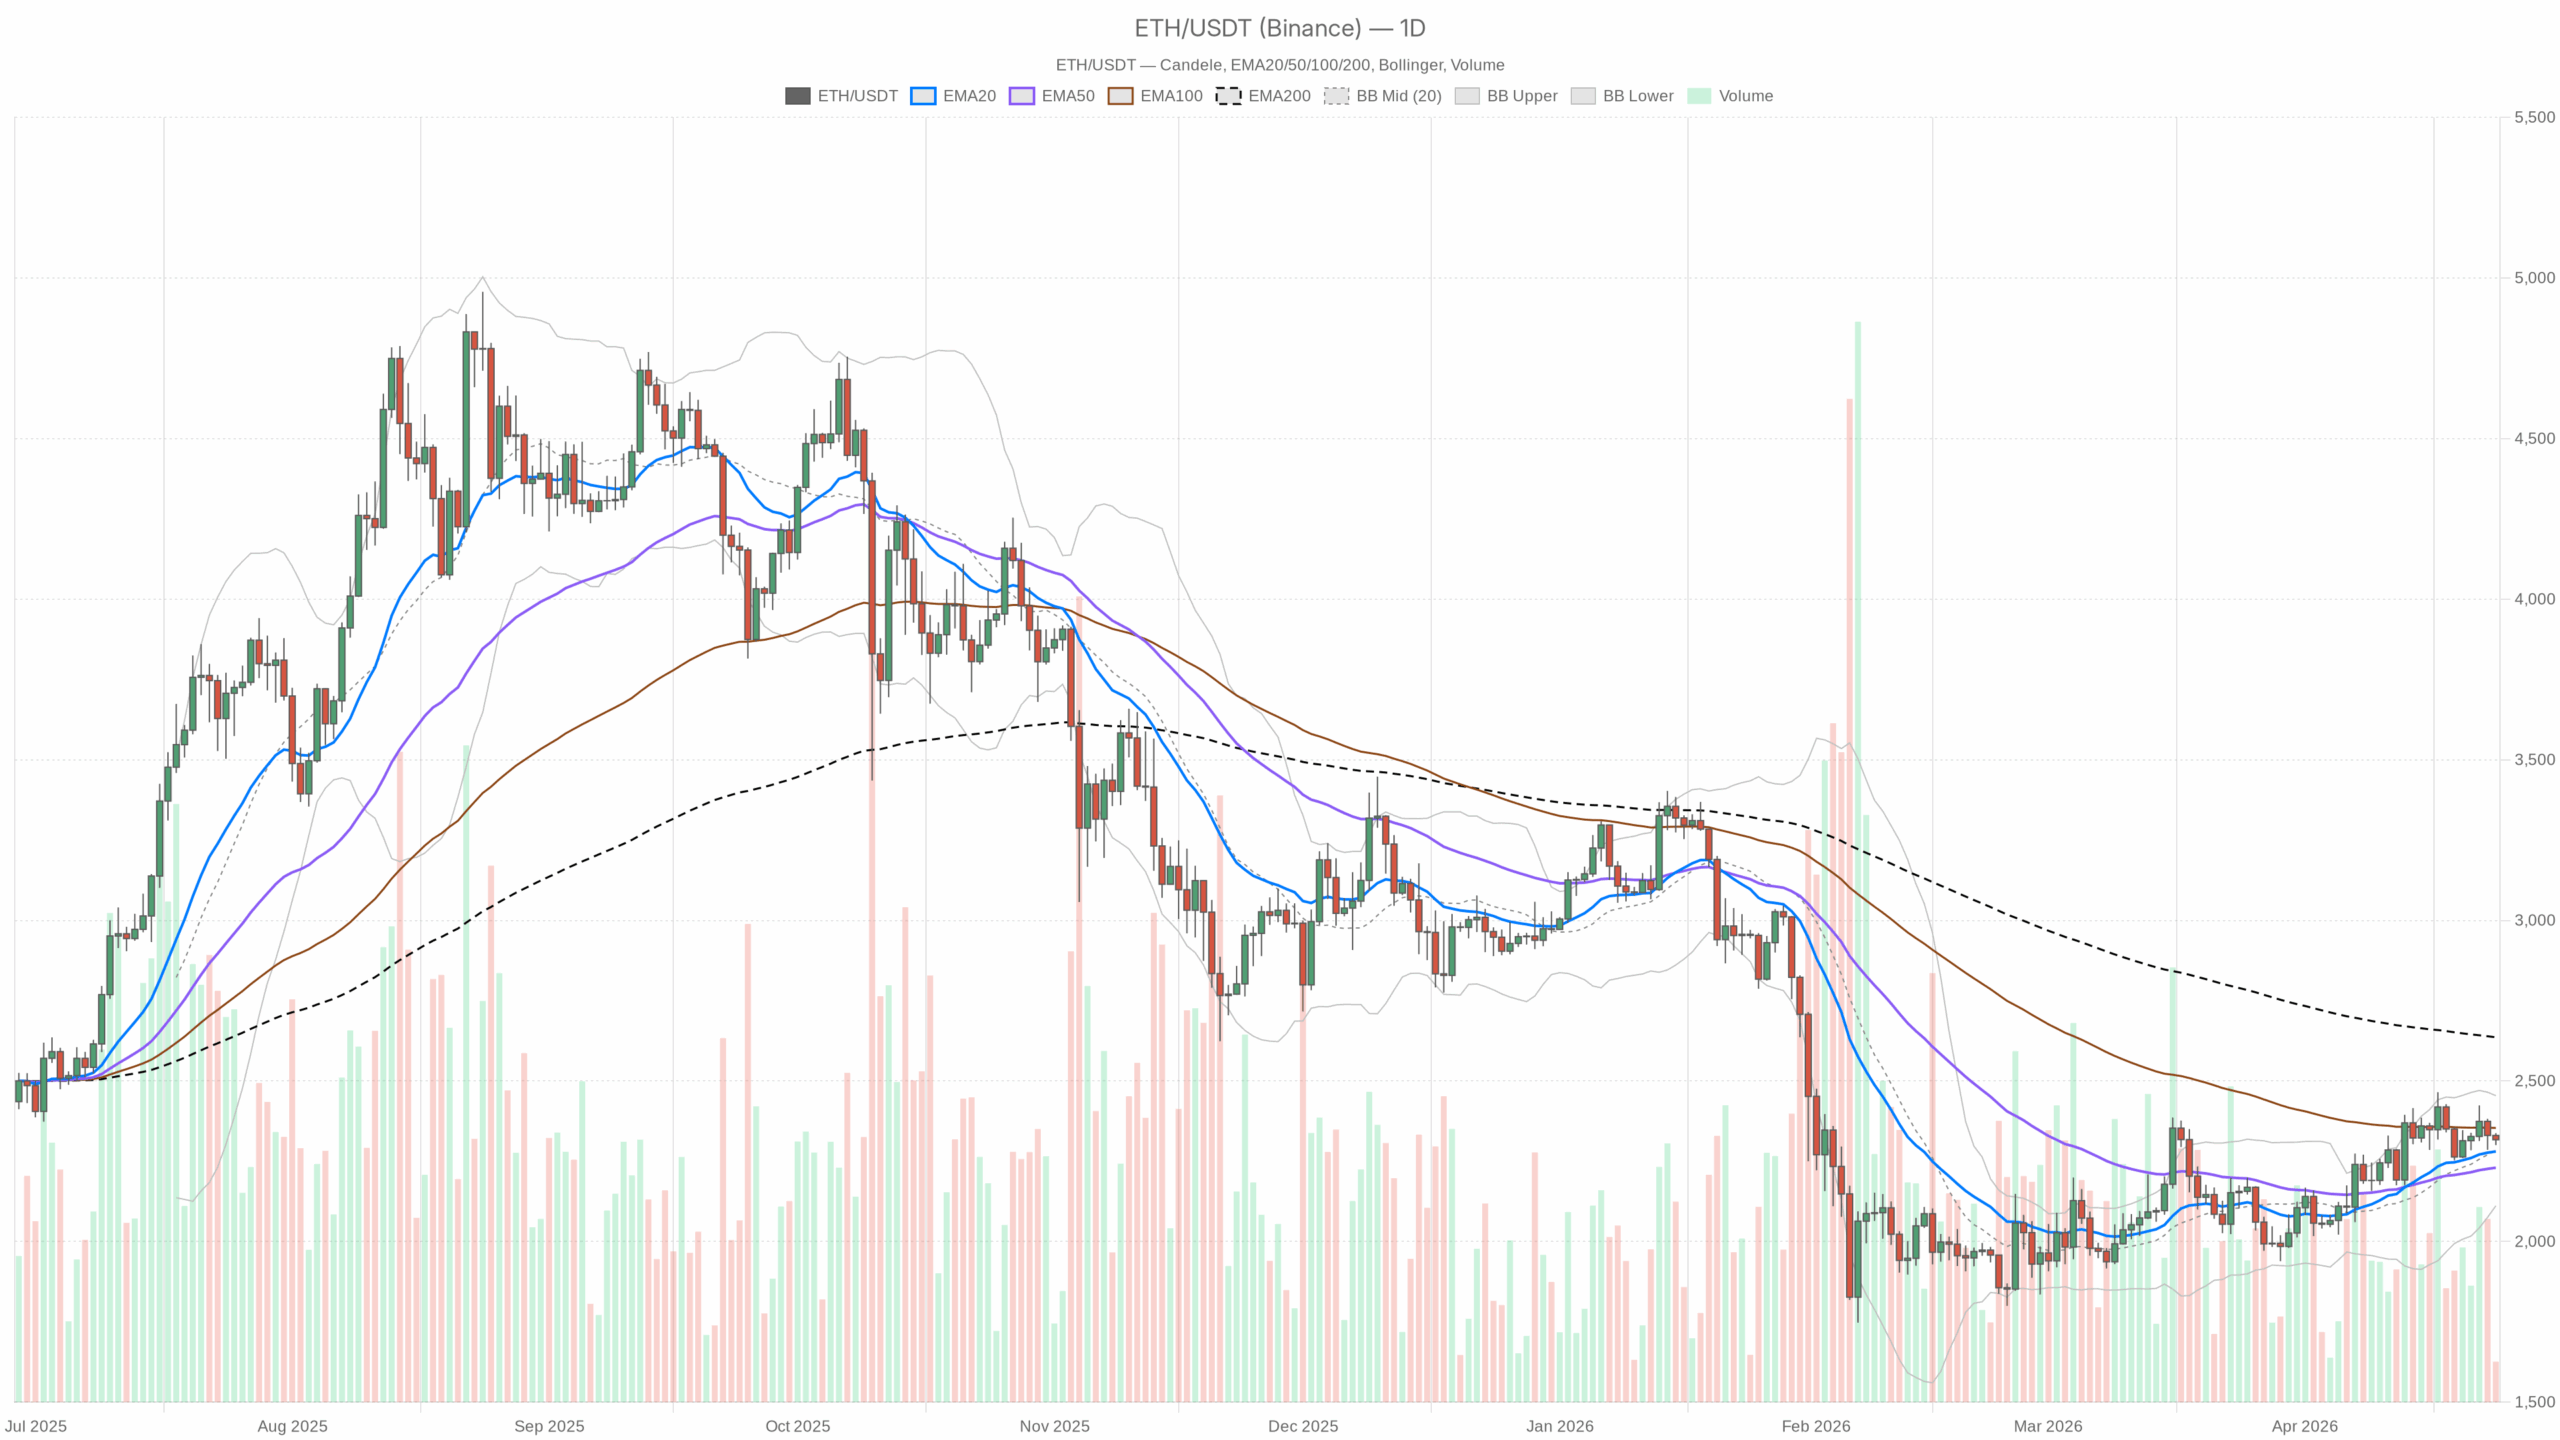
The main scenario for Ethereum is neutral, with a slight constructive tilt only while daily support continues to hold. The daily regime is neutral, and that fits the chart well. ETH is above short- and medium-term trend gauges, but still below the long-term trend line.
That usually describes a transition market rather than a clean trend market. If bulls want a proper continuation move, they need to reclaim overhead resistance with stronger momentum. However, if bears want to regain control, they need to push price back under the recent support cluster.
Daily timeframe: The macro bias is stable, not strong
Ethereum closed the day at 2316.99. That is just above the 20-day EMA at 2280.48 and the 50-day EMA at 2229.82, but still well below the 200-day EMA at 2635.84. This structure shows short-term trend repair, not a full reversal of the larger downtrend.
The daily RSI is 54.69, which is mildly bullish but not stretched. Therefore, momentum is positive enough to support price above nearby trend support, yet not strong enough to signal aggressive upside acceleration. The market still has room in both directions.
The daily MACD line is 54.76 versus a signal line at 57.63, with a histogram at -2.87. Momentum has not collapsed, but it is clearly losing thrust. Moreover, the MACD sitting slightly under the signal line suggests the rebound is slowing.
On the Bollinger Bands, the daily mid-band sits at 2282.71, the upper band at 2454.10, and the lower band at 2111.31. Price is hovering only slightly above the middle of the range. That is a balanced location, not one that signals trend expansion.
Daily ATR is 102.27, which means volatility remains meaningful. Ethereum is not in a dead market. However, it still has enough range to produce sharp moves once direction becomes clearer, with swings of more than $100 possible in a normal daily cycle.
The daily pivot structure reinforces how compressed this area is. The pivot point is 2318.24, almost exactly where price is trading. Resistance 1 is 2336.25 and Support 1 is 2298.97. When price sits right on the pivot, it usually reflects indecision.
1-hour timeframe: Short-term pressure is still a problem
The 1-hour chart weakens the daily recovery story. ETH is trading at 2316.80, below the 20-hour EMA at 2320.66, the 50-hour EMA at 2332.72, and the 200-hour EMA at 2332.95. That setup says intraday trend control still belongs to sellers, or at least buyers have not regained command.
The 1-hour RSI is 45.42, which leans soft without being oversold. In practice, that leaves room for another push lower unless buyers reclaim nearby moving averages quickly. Moreover, it points to a market under pressure, but not yet washed out.
The 1-hour MACD line is -7.93 against a signal line of -8.85, with a histogram at 0.92. This remains one of the more interesting conflicts on the board. Trend structure is weak, but momentum is trying to improve from negative territory.
Bollinger Bands on the 1-hour chart show a mid-band at 2318.77, an upper band at 2337.79, and a lower band at 2299.74. Price is hovering just under the mid-band, which keeps the immediate tone cautious. A move back above the middle band would help stabilize the short-term picture.
The 1-hour ATR is 13.46, so intraday volatility is active enough for sharp rotations, but not chaotic. Therefore, this is the sort of environment where false breaks are common, especially when price is stuck around the pivot.
That pivot is 2313.95, with R1 at 2321.91 and S1 at 2308.85. Price is sitting just above the pivot and just below resistance. In this Ethereum price setup, bulls need acceptance above 2322 to prove they are rebuilding control.
15-minute timeframe: Execution context is improving, but not enough on its own
The 15-minute chart is firmer than the 1-hour chart. ETH trades at 2317.14, above the 20-period EMA at 2312.66 and the 50-period EMA at 2315.76, while still below the 200-period EMA at 2332.40. That usually means a short-term bounce is underway inside an unresolved intraday structure.
The 15-minute RSI is 55.68, which shows buyers have some immediate traction. Still, it is not strong enough to matter much unless the 1-hour chart also starts to improve. That said, the reading is constructive.
The 15-minute MACD line is -0.44, above the signal line at -1.26, with a histogram at 0.81. That tells you short-term momentum is turning up. However, because the move is happening below the 15-minute 200 EMA and the 1-hour trend cluster, it still looks more like a rebound than a confirmed breakout.
The 15-minute Bollinger Bands sit at 2312.36 in the middle, 2317.58 on the upper side, and 2307.14 on the lower side. Price is pressing the upper band, which often happens during short-term momentum bursts. It can continue if buyers keep pressing.
The 15-minute ATR is 5.92, which means local ranges are tradable but still compact compared with the daily backdrop. Therefore, this is useful for execution timing, not for defining the bigger bias.
The 15-minute pivot comes in at 2316.24, with R1 at 2319.96 and S1 at 2313.41. Price is marginally above the pivot and approaching first resistance. That gives buyers a slight tactical edge, but only on a very short leash.
Bullish scenario
The bullish case is straightforward: Ethereum continues to defend the daily support zone around the 20-day EMA and turns this pause into another push higher. For that to happen, bulls need to clear the immediate resistance area around 2336 on the daily pivot structure, then build acceptance above the 1-hour 50 and 200 EMAs near 2333.
If they do that, the market would likely start looking toward the upper daily Bollinger region near 2454. What would support this view is a combination of the daily chart staying above 2280, the 1-hour RSI moving back above 50, and intraday price action holding above the pivot.
Invalidation for the bullish scenario would come from a loss of the 2299-2280 support pocket. If ETH falls back below that area decisively, the recovery structure starts to look fragile rather than healthy.
Bearish scenario
The bearish case is not about immediate collapse. Instead, it is about the rebound losing energy and rolling over from an unfinished larger recovery. Daily MACD is already softening, and the 1-hour chart still leans bearish.
If price fails to reclaim the 2330-2336 area and drops back below 2299, sellers could press for a deeper retest toward the lower daily support zone. The broader Bollinger lower band at 2111 acts as the more distant downside reference.
The bearish argument gets stronger if the 1-hour chart stays below its trend averages and the short-term bounce on the 15-minute chart fades quickly. Invalidation would be a sustained move back above the hourly trend cluster and daily resistance, especially with stronger momentum expansion.
What traders should watch now
Right now, Ethereum price rewards patience more than conviction. The daily chart says the asset is not weak enough to dismiss, but the lower timeframes say it is not ready to trend cleanly yet. That is the core message: structure is improving, momentum is mixed, and price is trapped around a pivot.
Positioning here should respect volatility. The daily ATR shows ETH can move hard once it leaves this compression zone, and the disagreement between the daily and hourly charts raises the odds of whipsaw before a clear direction emerges. If bulls take back 2333-2336 and hold it, the tone improves quickly. If price loses 2299 and then 2280, the market likely shifts back into defense.
Until one of those levels gives way convincingly, this remains a neutral market with short-term tactical swings rather than a high-conviction trend.