




Sandisk stock remains in a firmly bullish trend, but SNDK is now trading in an overheated zone. The broader structure still favors the upside. However, stretched momentum and elevated volatility increase the risk of sharp pullbacks and volatile pauses.
Summary
Sandisk stock trend stays decisively bullish
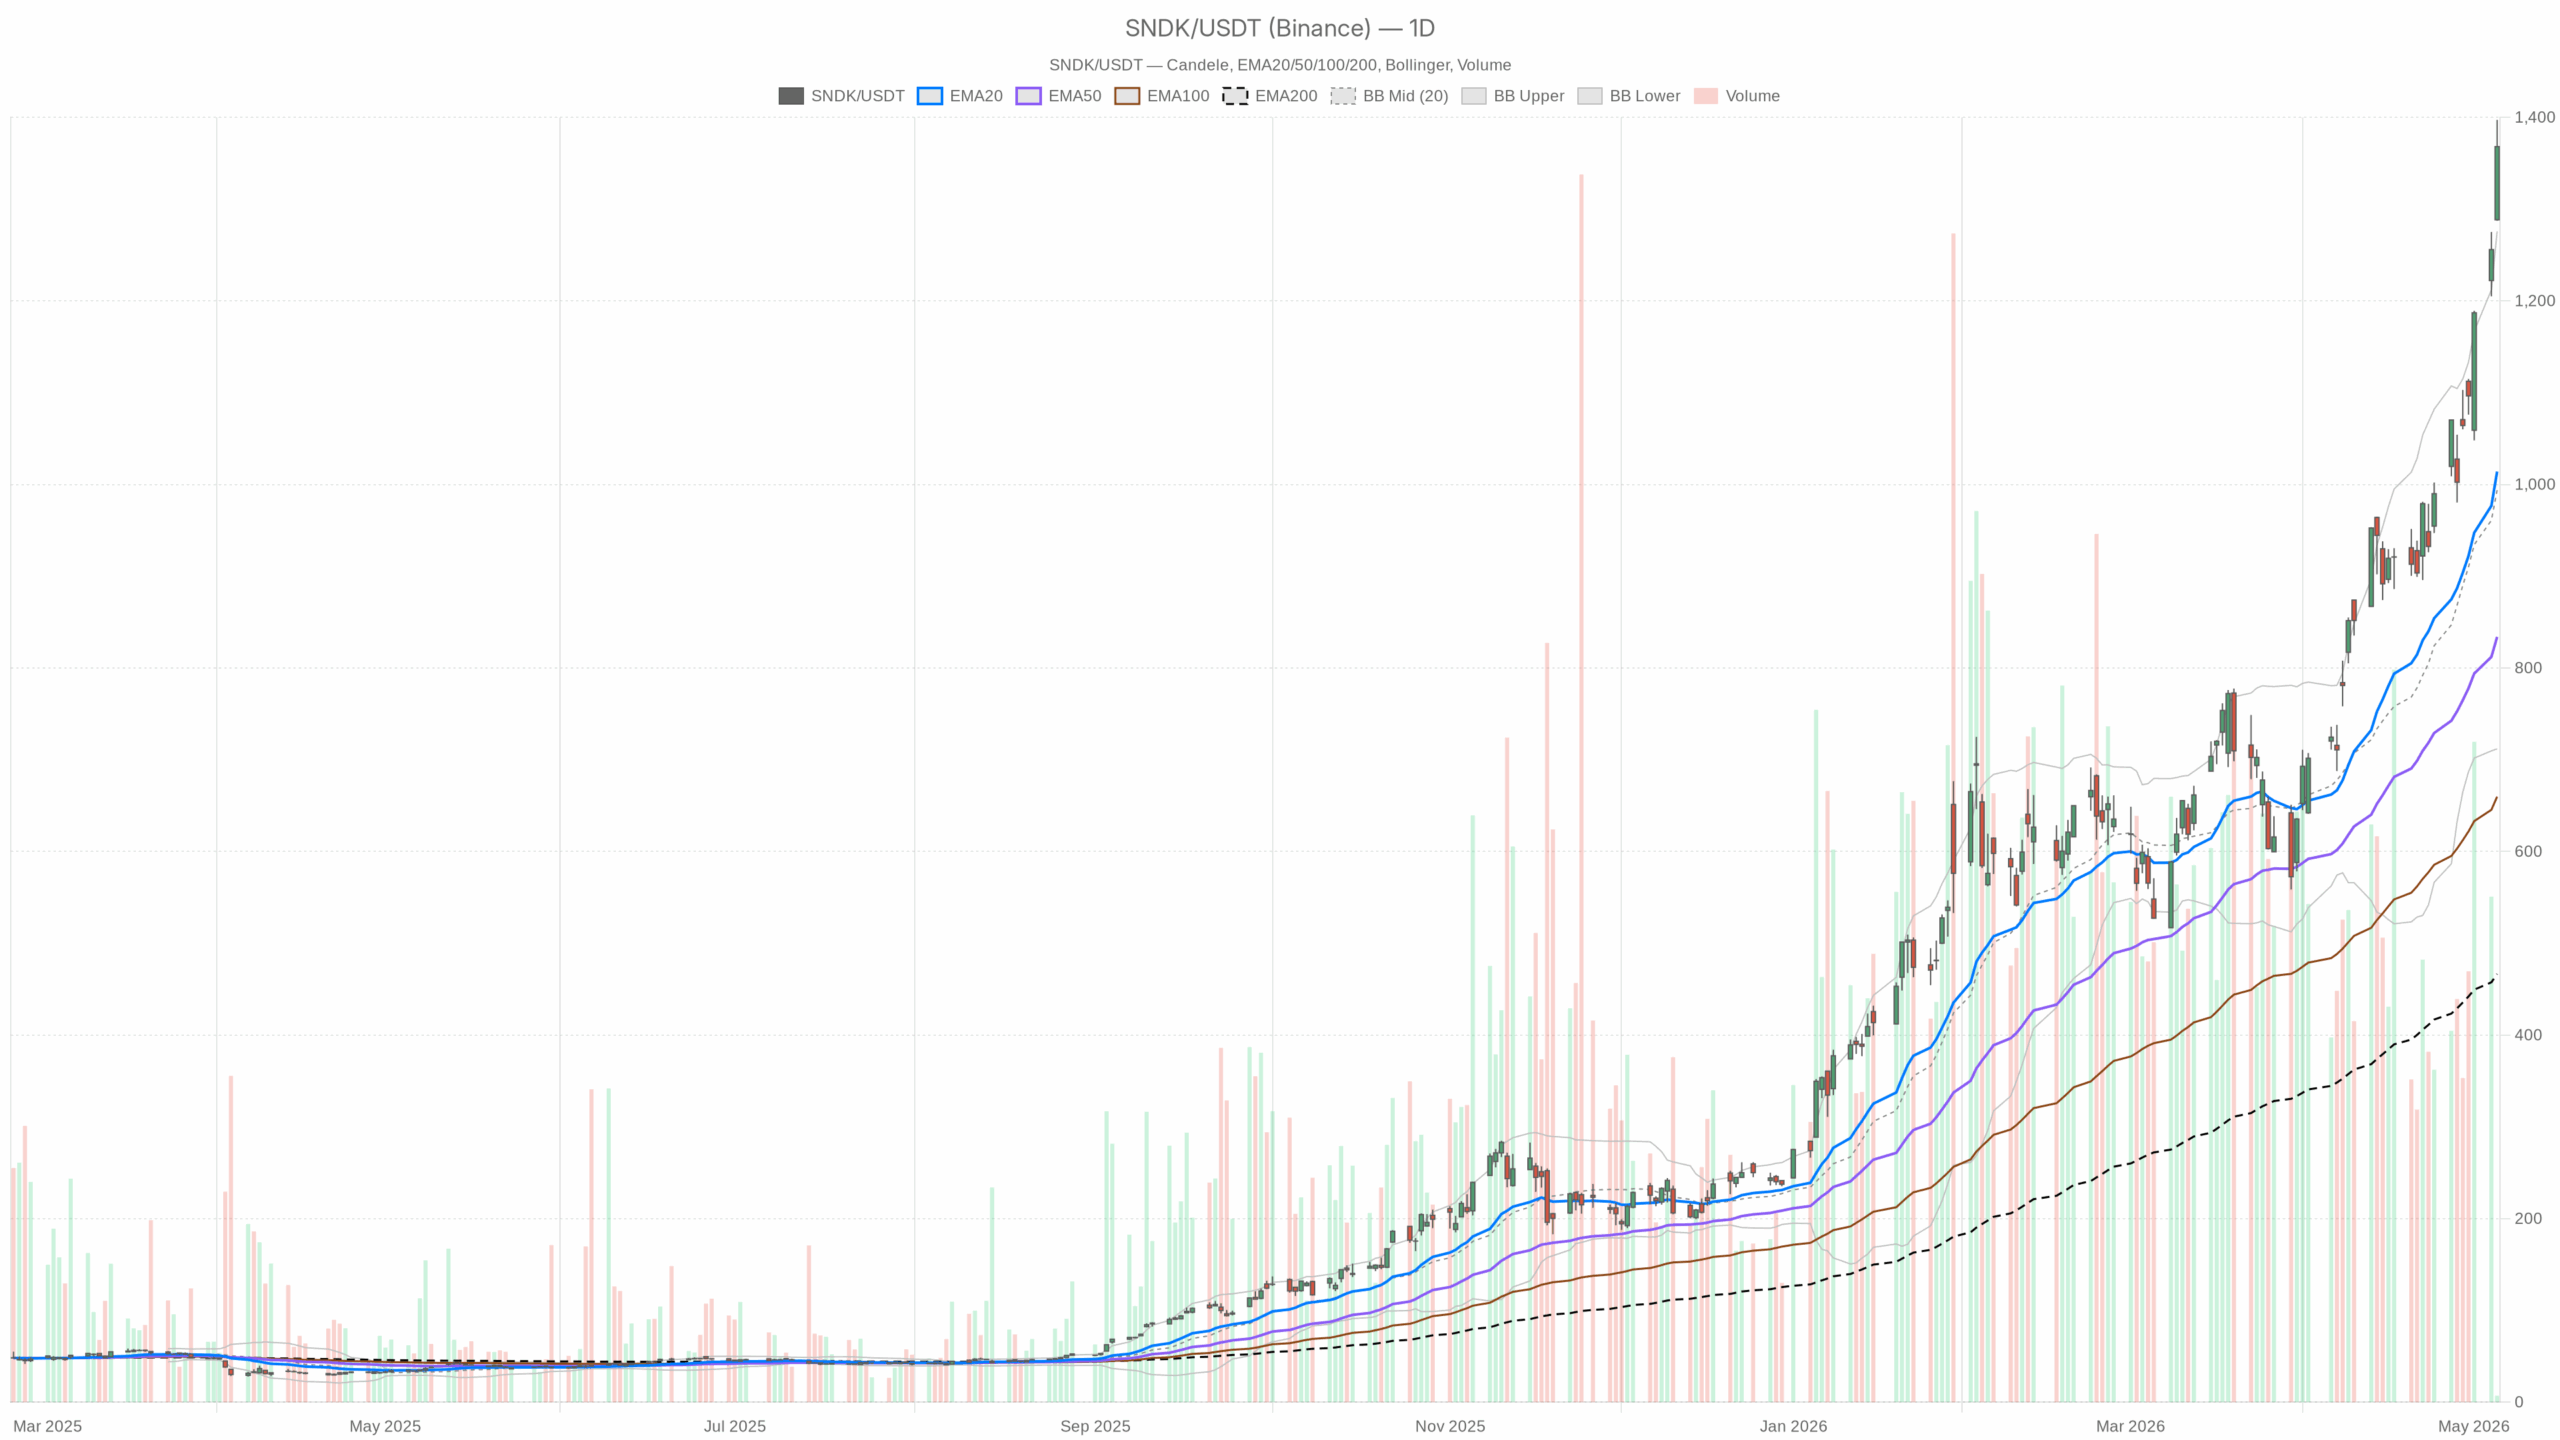
Sandisk stock closed at 1368.09 on the daily chart. That is well above the EMA20 at 1014.04, the EMA50 at 833.89, and the EMA200 at 466.55. As a result, the broader trend remains decisively higher, and buyers still control the medium- and long-term tape.
Momentum also supports the upside on the daily timeframe. Daily MACD remains positive, with the line at 132.22 above the signal at 100.35 and a histogram reading of 31.87. Therefore, the uptrend still shows acceleration rather than fading strength.
At the same time, daily ATR stands at 76.7. That is elevated enough to warn that swings can remain wide even if the primary trend stays constructive.
Sandisk stock is strong, but momentum looks stretched
The quality of the rally now matters as much as the direction. SNDK is trading above the daily upper Bollinger Band at 1275.66, while daily RSI sits at 80.14. That combination points to a market that is strong, but also stretched after a sharp run.
In practical terms, bullish momentum is intact. However, the probability of sharp pullbacks and volatile pauses is rising. This is not a weak chart. Instead, it is a strong chart trading in a stretched condition.
Pivot levels define the next SNDK breakout test
Price is also pressing near the daily pivot structure. The daily pivot point stands at 1350.88, with resistance at 1414.47 and support at 1304.5. Holding above the pivot keeps near-term control with buyers.
A push through 1414.47 would reinforce the breakout narrative. On the other hand, a slip back toward 1304.5 would test whether this move has enough sponsorship to hold.
Hourly chart confirms the bullish bias
The hourly chart confirms the daily bullish bias. Still, it also makes the overextension issue harder to ignore. SNDK closed at 1368 on the 1H chart, above the EMA20 at 1211.59, the EMA50 at 1119.11, and the EMA200 at 922.78.
That keeps the shorter trend aligned with the daily picture. Meanwhile, it shows no real structural breakdown beneath the surface.
Hourly momentum remains hot
Hourly momentum is even hotter than the daily reading. RSI is 81.32, and price is sitting essentially on the upper Bollinger Band at 1367.88. MACD is also firmly positive, with the line at 69.52 above the signal at 52.61 and a histogram reading of 16.91.
The implication is straightforward. Momentum buyers are still active, but the stock is vulnerable to fast mean reversion if buying pressure cools even briefly.
Hourly pivots tighten the short-term setup
The hourly pivot point stands at 1374, with resistance at 1386 and support at 1356. Current price sits just below the hourly pivot after trading up to 1392. That creates short-term tension.
Buyers have clearly driven the trend. However, they now need to reclaim and hold above 1374 to keep pressure on the 1386 area and sustain the immediate breakout tone.
15-minute chart provides execution context
The 15-minute chart should be treated only as execution context, and it remains bullish as well. Price at 1368.09 is above the EMA20 at 1303.01, the EMA50 at 1238.96, and the EMA200 at 1110.28.
RSI at 76.66 and a positive MACD spread, with the line at 42.7 versus the signal at 34.98, show that short-term momentum is still pointed up. Still, the 15-minute upper Bollinger Band sits at 1401.33. That means intraday upside is already operating close to an expanded volatility envelope.
Sandisk stock outlook: bullish scenario vs. failed extension
The main scenario remains bullish, led by the daily chart and confirmed by the hourly trend. The market is rewarding momentum, and the news flow around a new 52-week high and a strong earnings-related move helps explain why buyers have stayed aggressive.
The bullish scenario is relatively clear from here. SNDK would need to keep holding above the daily pivot at 1350.88 and reclaim the hourly pivot at 1374 with conviction. If that happens, the path back toward 1386 and then the daily resistance zone near 1414.47 remains open.
Continued MACD strength and price holding above the short moving averages would support that continuation case. On the other hand, the bearish scenario is less about trend reversal and more about failed extension.
If Sandisk stock cannot retake 1374 on the hourly chart and starts slipping below 1356, the door opens to a deeper retracement toward the daily support zone at 1304.5. A loss of that level would be the first serious sign that the breakout is being rejected rather than merely digested. In that case, the current bullish view would be materially weakened.
Overall outlook for Sandisk stock
Overall, Sandisk stock still favors the upside because the daily trend is overwhelmingly positive and the lower timeframes have not broken that structure. However, momentum is crowded and volatility is elevated, so chasing strength at these levels carries more execution risk than it did earlier in the move.
Positioning now depends less on whether the trend is up and more on whether buyers can defend the breakout under increasingly stretched conditions.
