



Nvidia stock remains constructive on the daily chart, but short-term pressure has increased. NVDA is still holding above its key medium-term averages, yet softer momentum and a move below the 20-day EMA keep the near-term bias neutral rather than clearly bullish.
Summary
Nvidia Stock Daily Trend Stays Constructive but Loses Momentum
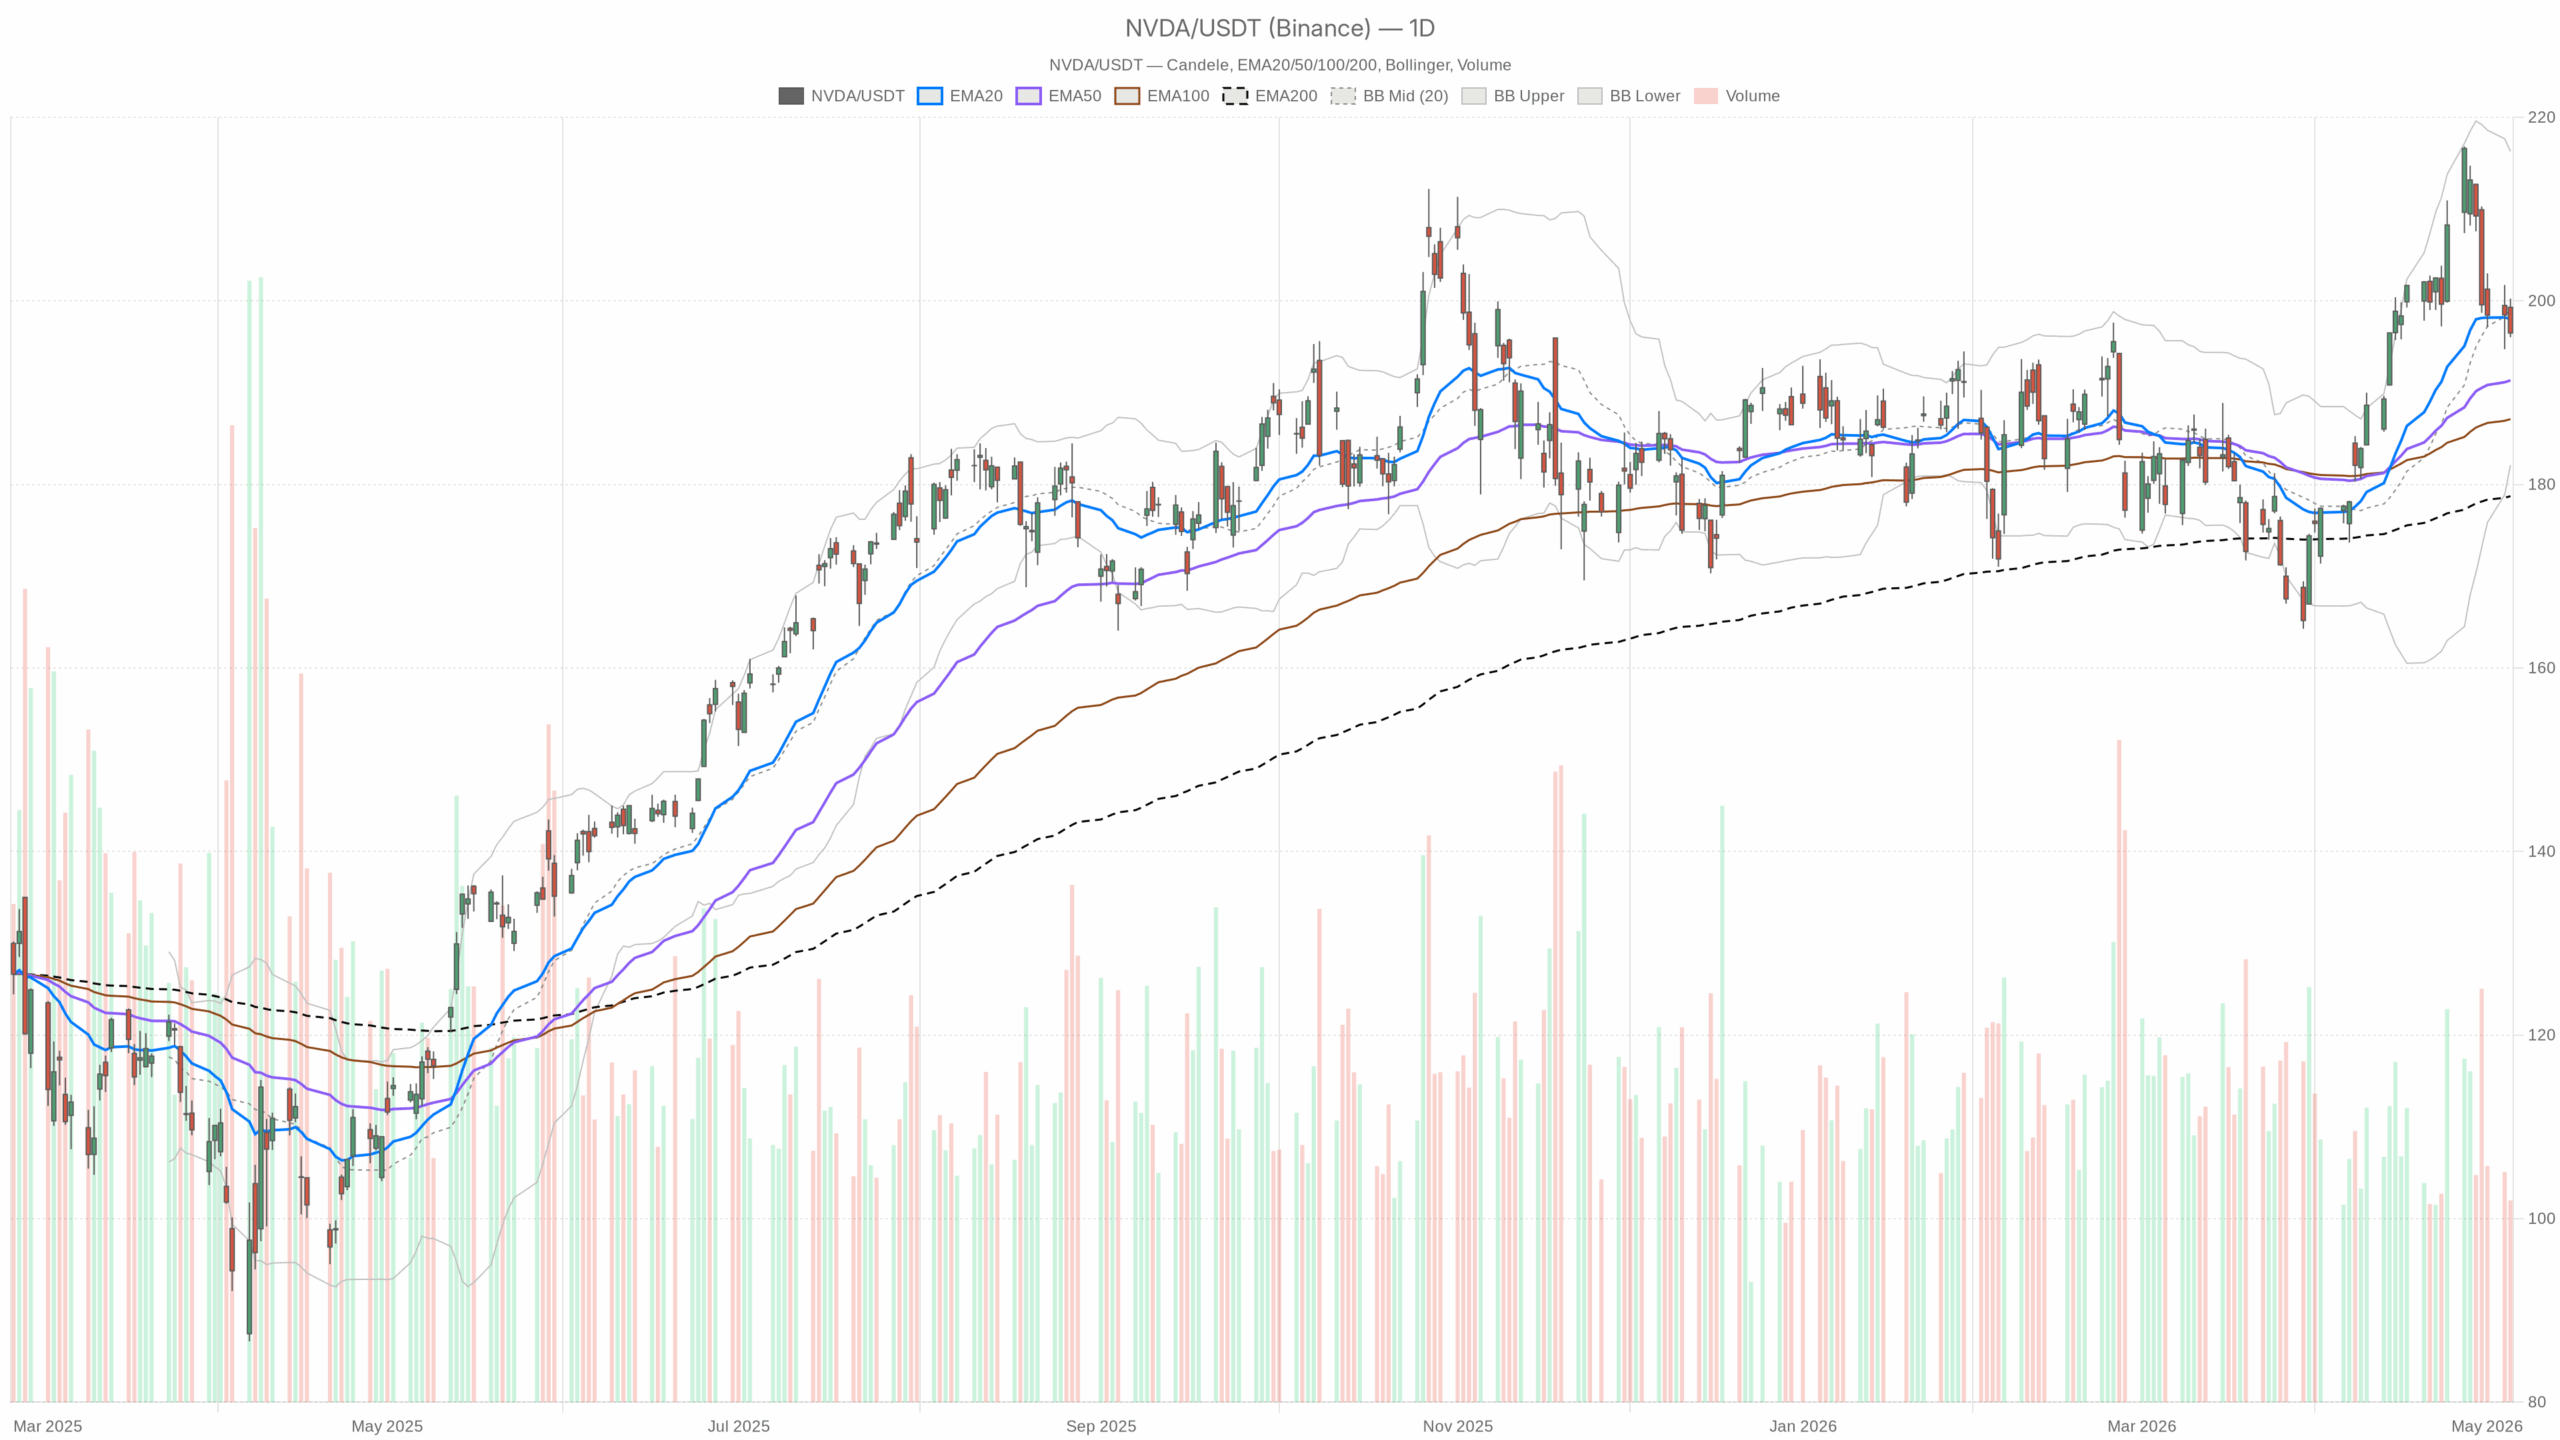
On the daily timeframe, NVDA closed at 196.50 after trading between 196.03 and 200.24. The stock is below the daily EMA20 at 198.04, but still above the EMA50 at 191.34 and the EMA200 at 178.72. In practical terms, that points to a pullback within a still-intact medium-term uptrend. The daily regime remains neutral, and that fits the current structure.
Meanwhile, daily RSI stands at 50.82. That is a balanced reading, neither oversold nor overbought. It shows momentum has normalized after the recent rally. As a result, Nvidia stock is no longer benefiting from strong directional thrust.
The daily MACD reinforces that loss of momentum. The MACD line is 4.69 versus a 5.88 signal line, while the histogram is negative at -1.2. Together, those readings show the recent upside impulse has faded. However, the larger trend has not fully broken down.
Volatility and Daily Pivot Levels
Notably, the daily Bollinger midline sits at 199.19, almost in line with the 20-day average. The upper and lower bands stand at 216.28 and 182.10. With price below the mid-band but well above the lower band, Nvidia stock is trading in the lower half of its recent volatility range. That usually reflects consolidation or a controlled retracement, not panic selling.
Daily ATR is 6.36, pointing to a still-elevated but manageable volatility backdrop. Therefore, swings can remain meaningful even without a clear trend break. Daily pivot levels also matter here. The pivot point is 197.59, with resistance at 199.15 and support at 194.94. Closing below the pivot keeps near-term pressure in place, while nearby support marks an important decision zone.
Nvidia Stock Hourly Chart Weakens the Daily Setup
However, the 1-hour chart weakens the daily picture. NVDA closed at 196.50 on the hourly frame as well. It sits below the EMA20 at 198.55 and below the EMA50 at 201.00, while remaining above the EMA200 at 194.89. That tells us the short-term trend is under pressure, yet not fully broken from a broader intraday perspective.
The hourly RSI reads 36.17, which is notably weak. It does not guarantee a bounce, but it shows sellers have controlled the recent intraday flow. At the same time, the hourly MACD remains negative, with the line at -1.68 and the signal at -1.90. Still, the histogram has turned slightly positive at 0.22, which is an early sign that downside momentum may be easing.
Intraday Range and Balance Point
Hourly Bollinger Bands run from 195.66 to 200.18, with a midline at 197.92. Price near the lower part of that range shows Nvidia stock is pressing into weaker intraday territory. Still, it is not breaking down aggressively.
Hourly ATR at 1.91 implies active but not disorderly movement. Meanwhile, the hourly pivot at 196.38 shows price is hovering around a short-term balance point. Resistance at 196.72 and support at 196.15 create a very tight near-term range. That setup often precedes a directional move.
Short-Term Nvidia Stock Pressure Remains Visible on the 15-Minute Chart
In contrast, the 15-minute chart is useful mainly for execution context, and it remains soft. Price is below the EMA20, EMA50, and EMA200 on that frame. RSI stands at 39.81, and the MACD histogram is slightly negative. The 15-minute regime is bearish, which suggests short-term traders are still selling rallies rather than chasing upside.
Bollinger positioning near the lower half of the intraday band and a modest ATR of 0.58 suggest the weakness is controlled, not capitulative. Even so, this timeframe continues to lean against a quick upside recovery.
Timeframe Conflict Keeps the Nvidia Stock Bias Neutral
This creates a clear timeframe conflict. The daily chart does not support a strong bearish call because Nvidia stock is still above its key medium-term averages. Yet the hourly and 15-minute charts show short-term pressure and weaker momentum. Therefore, the market is caught between a larger uptrend that has not failed and a near-term tape that is struggling to regain traction.
Bullish Scenario for Nvidia Stock
The bullish scenario depends on Nvidia stock reclaiming the daily pivot at 197.59 and then pushing back above the 20-day EMA near 198.04. A move through daily resistance at 199.15 would strengthen that case. If price holds above those levels and hourly momentum continues to recover, the current pullback would start to look like a pause within the broader uptrend rather than the start of a deeper correction.
Bearish Scenario for Nvidia Stock
On the other hand, the bearish scenario remains active while price stays below the daily pivot and below the 20-day average. A clean break under daily support at 194.94 would matter. It would also put the stock at risk of losing the hourly 200 EMA at 194.89. If that area gives way, the short-term weakness would no longer look like routine consolidation. Instead, it would suggest the daily pullback is extending into a more meaningful retracement.
News and Sentiment Context Around NVDA
News flow remains broadly supportive in tone, with continued focus on Nvidia’s size, AI demand, customer spending, and expectations around May 20. However, the market is not trading on optimism alone right now. Reuters also highlighted that Alphabet is closing in on Nvidia’s position as the world’s biggest company. That adds a competitive and sentiment dimension at a time when leadership expectations are already high.
Nvidia Stock Outlook
Overall, Nvidia stock remains in a neutral daily setup with a weaker short-term undertone. The bigger trend is still intact, but momentum has faded and intraday charts have not yet confirmed a fresh leg higher. Traders are watching a narrow support zone around 194.9 to 196.1 and a recovery zone around 197.6 to 199.2. Until one side breaks decisively, volatility should remain active and conviction should stay measured.
