




Tesla Stock is holding a constructive near-term tone as TSLA trades back above its major moving averages. The daily chart now leans bullish, although the stock is pressing into a key resistance zone near $400 where confirmation is still needed.
Summary
Tesla Stock Regains Key Daily Trend Levels
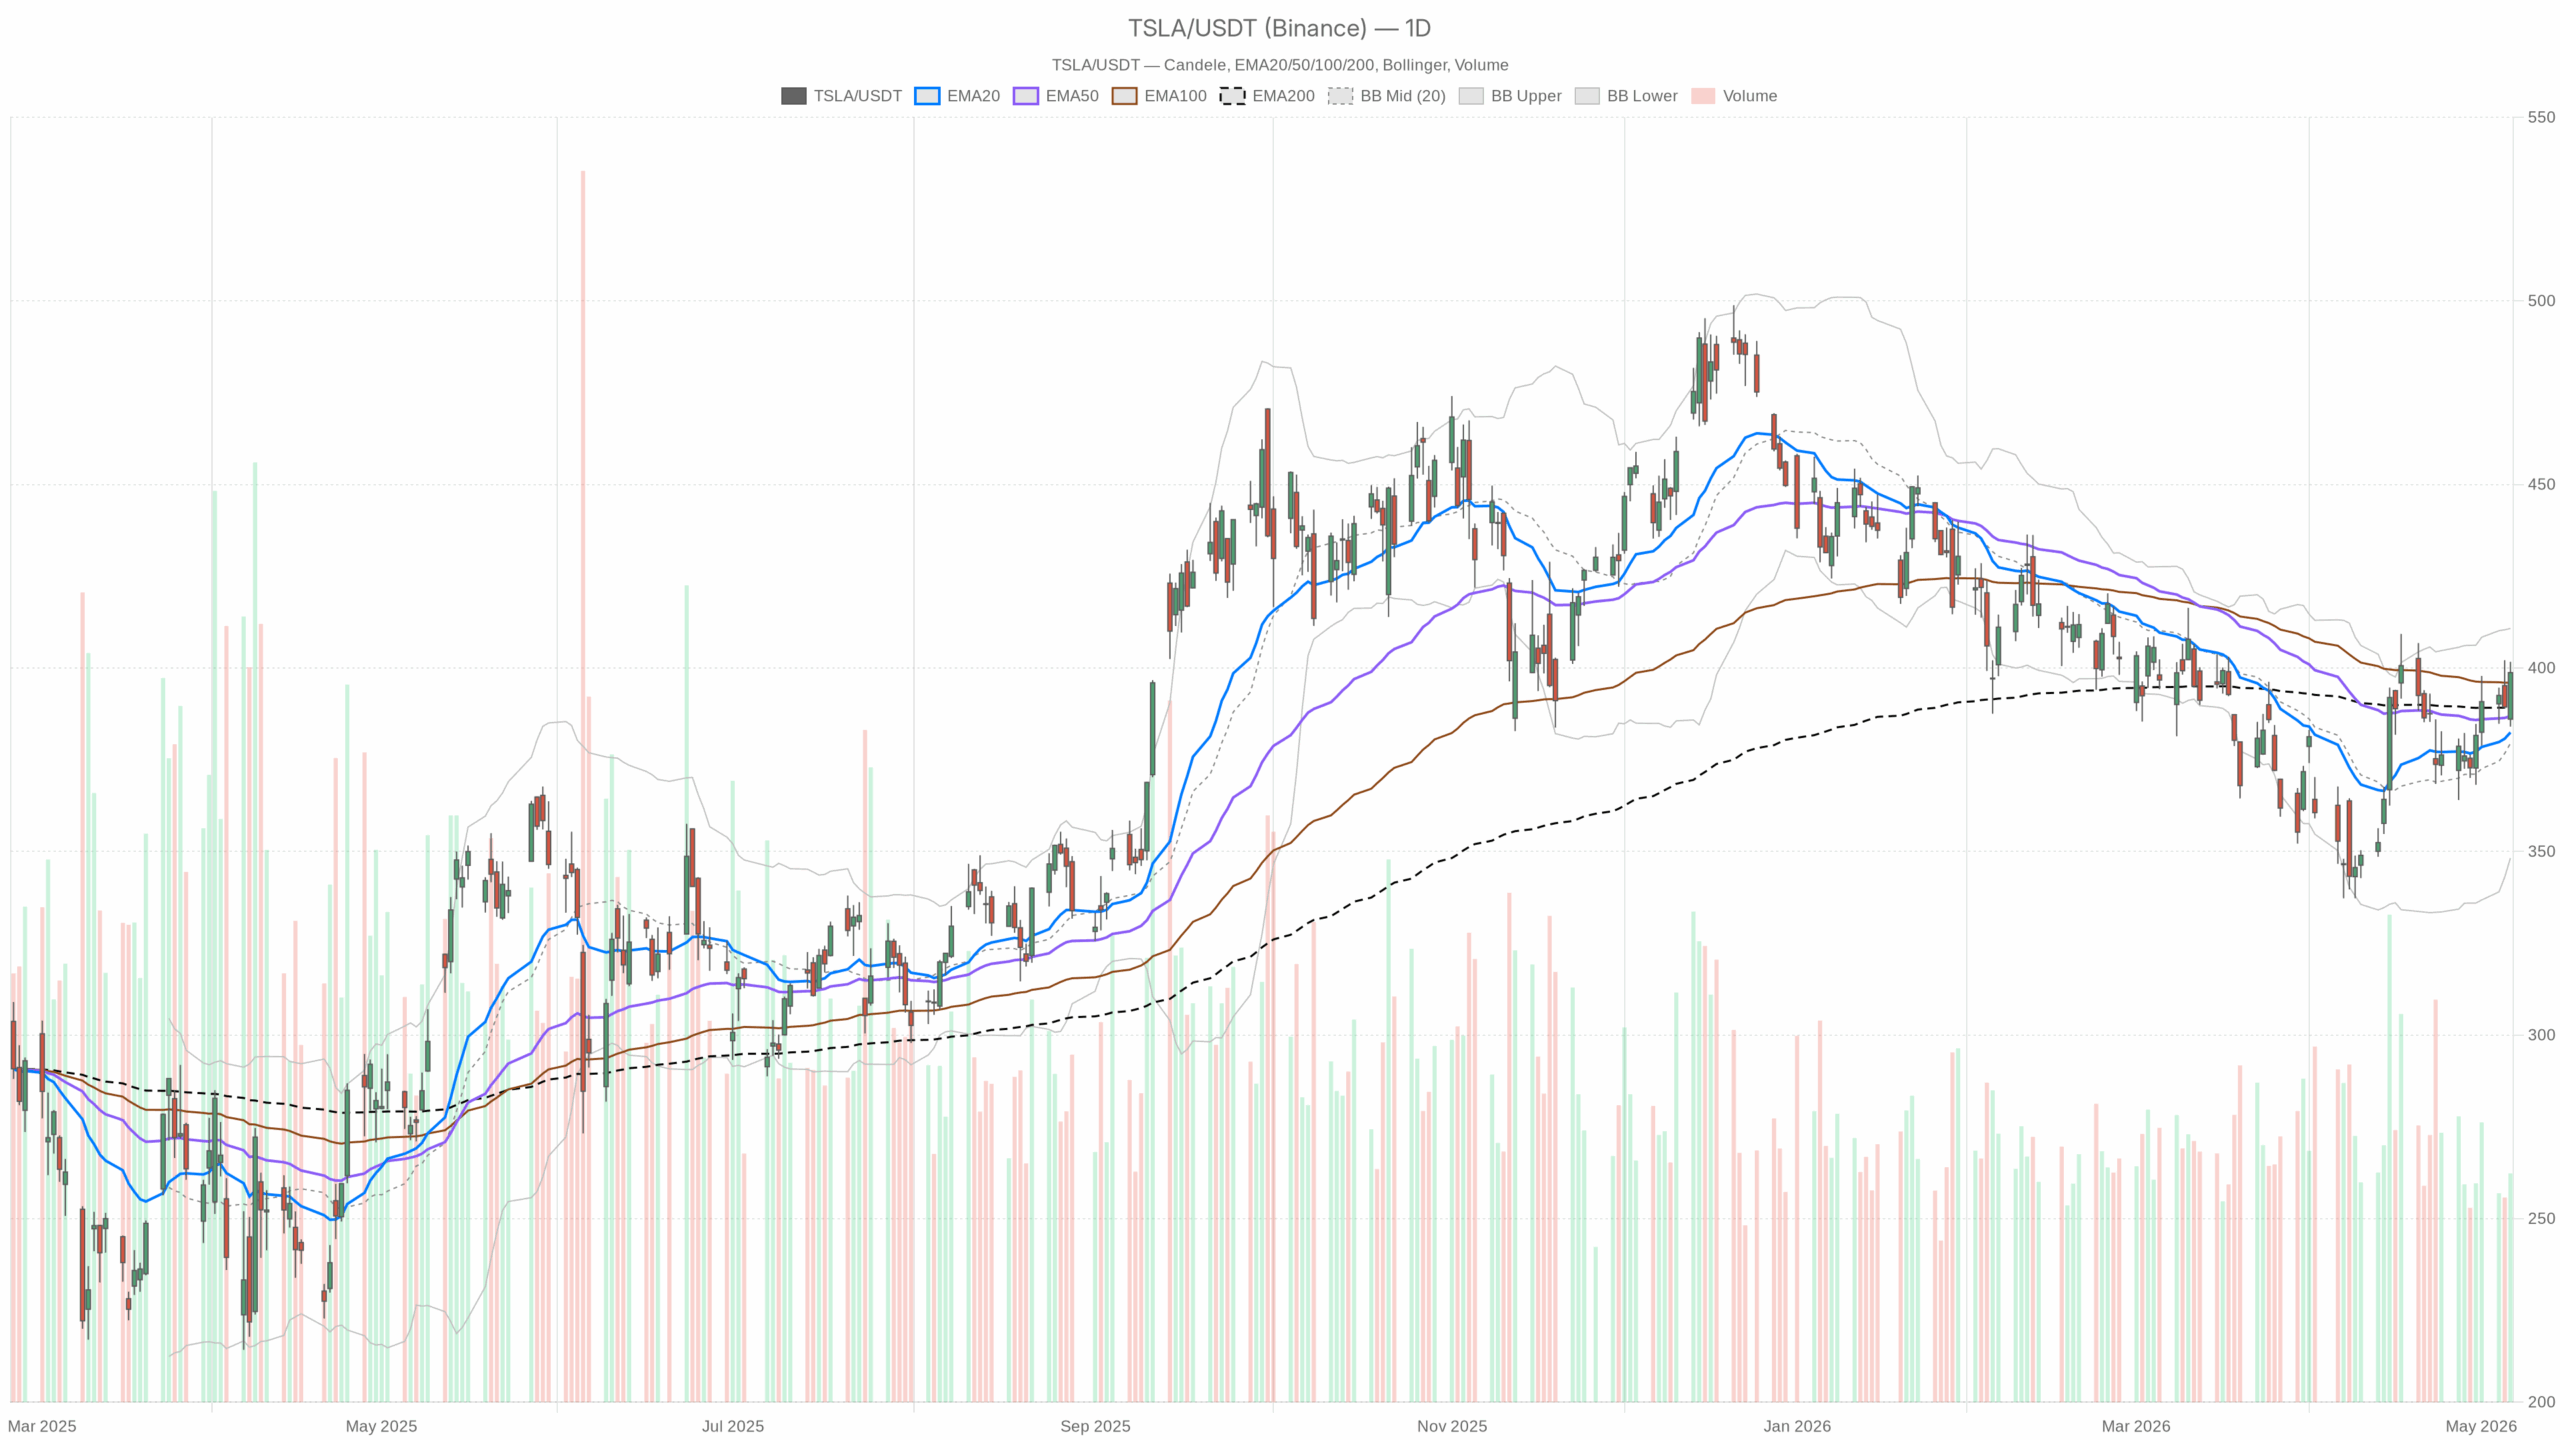
The latest daily close at 398.73 leaves TSLA above the 20-day EMA at 382.44, the 50-day EMA at 386.88, and the 200-day EMA at 389.27. That matters because it points to improving trend structure after a period of more neutral price behavior.
On the daily timeframe, price is pressing toward the psychologically important 400 area and trading above the daily pivot at 394.81. Meanwhile, resistance stands at 405.60, while first support rests at 387.94. In practical terms, the market has shifted from balance to upside pressure, but it is also nearing a zone where sellers may reappear.
Daily Momentum Still Supports the Bullish Case
Momentum on the daily chart looks supportive rather than stretched. RSI stands at 59.39, which signals positive momentum without reaching an extreme condition.
MACD also reinforces the stronger tone. The MACD line is at 3.31, above the signal line at 0.67, while the histogram remains positive at 2.64. Together, those readings show upside momentum is building rather than fading.
Tesla Stock is also trading in the upper half of its daily Bollinger range, with the upper band at 410.75 and the middle band at 379.48. This places price closer to the top of the recent volatility envelope. Therefore, it reflects demand strength, but it also warns that upside may become less efficient if the stock pushes into resistance too quickly.
Daily ATR sits at 13.97. That suggests volatility remains meaningful, and price swings around key levels can still be broad.
Hourly Tesla Stock Analysis Shows Buyers Still in Control
The hourly chart broadly confirms the daily bias, which is important. TSLA closed at 398.52 on the 1H timeframe, still above the 20-hour EMA at 394.01, the 50-hour EMA at 388.65, and the 200-hour EMA at 381.35. This keeps the short-term trend aligned with the broader move and suggests buyers still control the tape above the mid-390s.
Momentum Is Positive, but Acceleration Has Slowed
However, the hourly structure is not yet a clean breakout extension. RSI on the 1H chart is 61.64, which remains firm, while MACD is still positive with the line at 3.42 above the signal at 3.05. The histogram, though, is only 0.37. That tells us momentum remains positive, but the rate of acceleration has moderated.
There is also a useful short-term clue in the hourly Bollinger Bands and pivots. Price closed just under the hourly pivot at 399.17 and below hourly resistance at 400.12, while the upper Bollinger Band stands at 401.06. In other words, TSLA is pressing into a local ceiling near 400 to 401, where breakout confirmation is still needed.
Intraday Tesla Stock Structure Signals a Pause, Not a Reversal
The 15-minute chart adds execution context rather than changing the broader view. Price remains above the 15-minute EMA20 at 397.72, EMA50 at 395.14, and EMA200 at 388.24, so the intraday structure is still constructive.
At the same time, RSI at 56.02 is positive but modest, and MACD has softened slightly. The MACD line is at 1.76, just below the signal at 1.81, with a marginally negative histogram of -0.05. That implies a short-term pause inside a broader bullish setup, not a clear reversal by itself.
Notably, the short-term pivot structure also shows hesitation. The 15-minute pivot is 399.06, with resistance at 399.90 and support at 397.67. Since the latest close sits at 398.52, the stock remains caught just under immediate intraday resistance. For traders watching timing rather than direction, that means the market may need either a clean push back through 399 to 400 or a brief reset toward support before the next directional move develops.
Tesla Stock News Supports the Story but Adds Friction
From a fundamental sentiment perspective, recent Tesla stock news helps explain why price is firm but not unchallenged. Reports around large-scale Optimus production and expanding robotaxi activity support the long-duration growth narrative. That adds fuel to the upside case.
On the other hand, concerns around safety risks, negative free cash flow, costly AI and robotics investment, and a recent downgrade introduce valuation friction. The result is a market that is willing to bid the story, but still demands technical confirmation near major resistance.
Key Tesla Stock Levels to Watch Near $400
The bullish scenario remains valid as long as Tesla Stock holds above the 394 to 395 area and especially above the daily support zone near 387.94. A sustained move above 400, followed by acceptance above 401 and then a push toward 405.60, would strengthen the case that the daily breakout is extending. If that happens, the upper daily Bollinger area near 410.75 becomes a credible upside reference.
In contrast, the bearish scenario begins to build if TSLA repeatedly fails at 400 to 401 and loses the 394.81 daily pivot with conviction. A deeper slide below 387.94 would weaken the current bullish thesis more seriously. That would push price back under important support and threaten the recent reclaim of the 50-day and 200-day averages.
Overall, Tesla Stock has improved technically and the daily chart now carries a modest bullish bias. The hourly chart supports that view, although it also shows momentum flattening as price tests a tight resistance band near 400. Meanwhile, the 15-minute chart points to short-term hesitation, not trend failure. Positioning therefore remains sensitive to whether TSLA can convert the 400 area from resistance into support, while volatility stays elevated enough to keep both breakout and rejection risks in play.
