

Allianz stock retains a constructive daily bias, but near-term momentum has cooled below resistance. The broader trend still favors buyers, although weaker intraday signals suggest consolidation or a shallow pullback may develop unless the stock quickly reclaims the key pivot zone.
Summary
Allianz Stock Keeps a Constructive Daily Trend
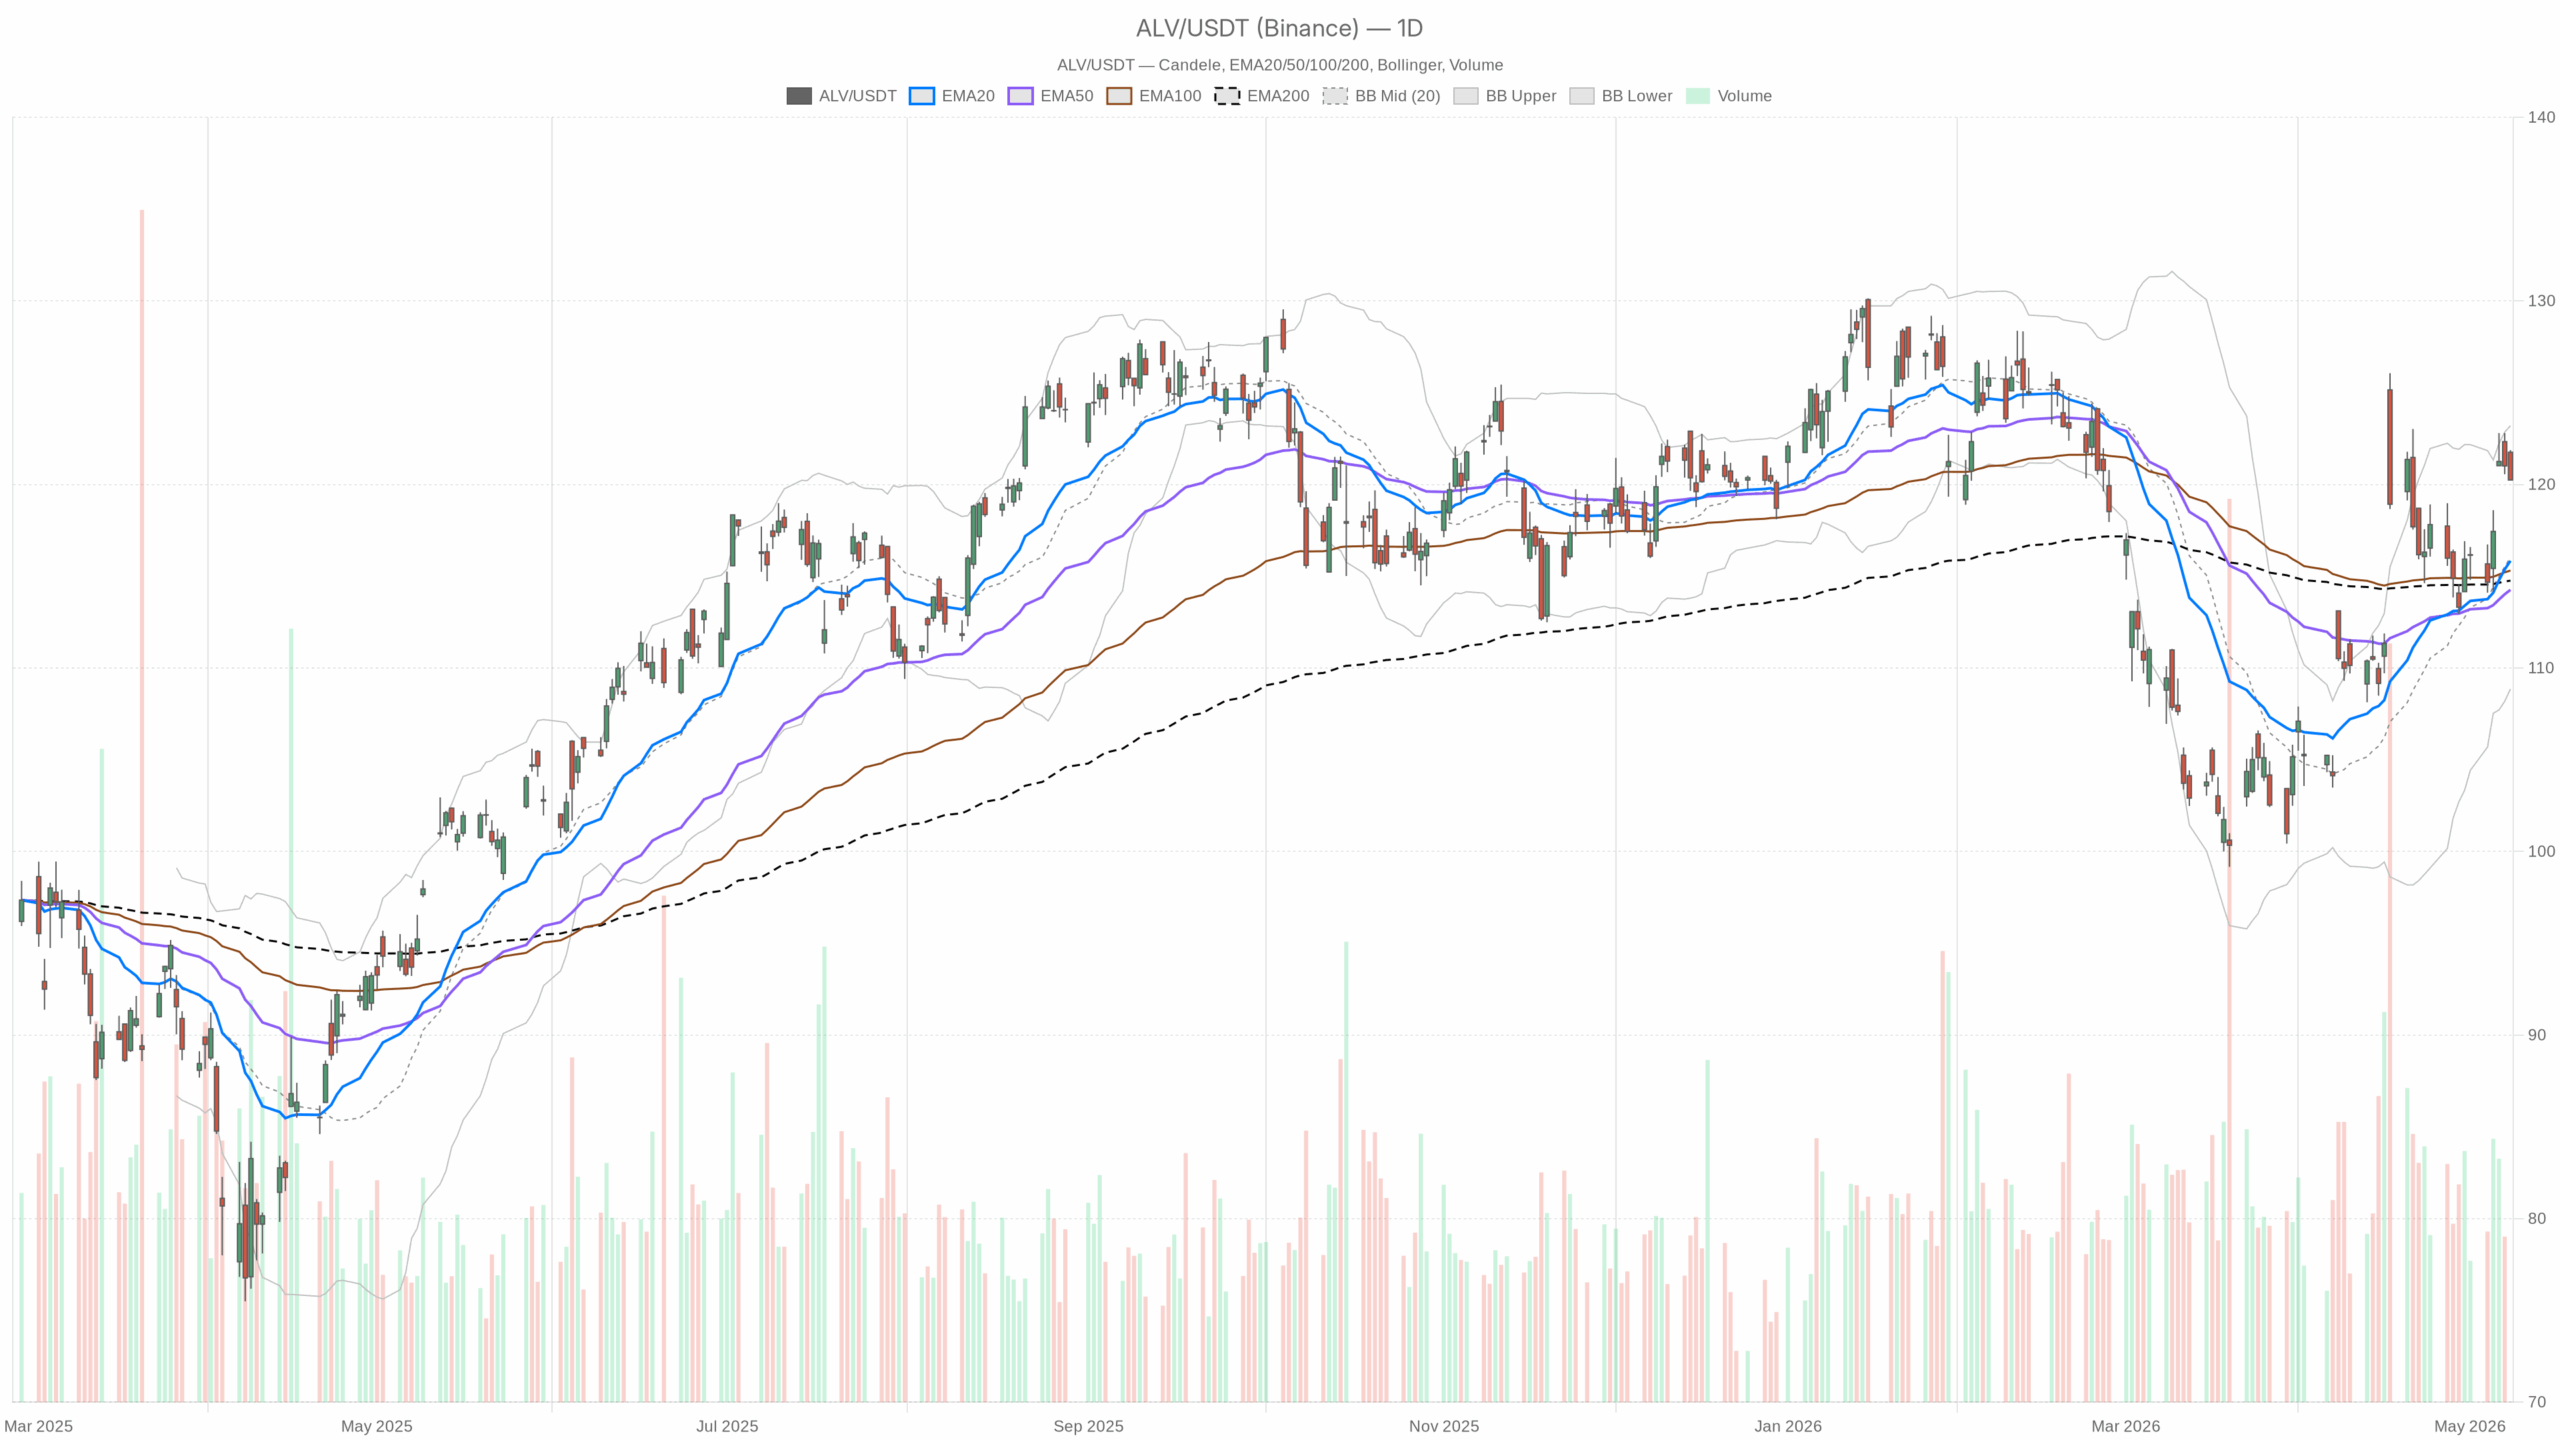
Allianz stock still carries a mildly bullish medium-term profile, but the short-term picture has become less straightforward. On the daily chart, price remains clearly above its key trend averages. Therefore, the broader bias stays constructive even after the latest pullback toward 120.24.
The stock closed at 120.24, while the 20-day EMA stands at 115.84, the 50-day EMA at 114.26, and the 200-day EMA at 114.76. That alignment keeps price above all major trend references. It points to a market trading from a position of strength rather than one in breakdown mode.
At the same time, the daily regime is marked as neutral. That fits a market that is rising, but not in a fresh trend expansion.
Daily Momentum for Allianz Stock Remains Supportive
Daily momentum remains supportive, although not aggressively so. The daily RSI is 61.71, which keeps Allianz stock on the firm side of neutral without entering a stretched zone. Buyers still hold control, but the move is no longer early.
Meanwhile, daily MACD remains positive, with the line at 2.42 above the signal line at 2.00 and a histogram reading of 0.42. That still favors underlying upside momentum. However, the current session itself was weaker.
Notably, daily Bollinger Bands place the upper band at 123.20 and the midline at 116.02. With price at 120.24, Allianz stock is trading in the upper half of its recent range. That supports the view of a constructive trend, but not a decisive breakout impulse.
Daily ATR at 3.12 also shows that normal swing size remains meaningful. As a result, short pullbacks can look sharp without changing the broader trend.
Short-Term Allianz Stock Signals Have Softened
Hourly trend structure is still intact
On the hourly chart, the message becomes more mixed. Price at 120.24 is sitting almost exactly on the 20-hour EMA at 120.26. It remains above the 50-hour EMA at 118.45 and well above the 200-hour EMA at 114.05.
That tells us the larger intraday trend has not broken. However, near-term momentum has flattened. In other words, the hourly structure weakens the strength of the daily bullish case without fully reversing it.
Momentum has cooled on lower timeframes
That softer intraday tone is visible in momentum readings. The hourly RSI is 53.79, which is modestly positive but far from strong. In contrast, hourly MACD has turned slightly bearish, with the line at 1.08 below the signal at 1.35 and a negative histogram of -0.27.
That implies the latest leg has lost pace. Buyers are no longer in full control over the short term.
Meanwhile, the 15-minute chart points to immediate selling pressure rather than a larger technical failure. Price is below the 15-minute EMA20 at 121.12 and EMA50 at 120.89. Still, it remains above the EMA200 at 118.29.
RSI at 33.65 is weak, and MACD is also negative, which signals short-term downside pressure. Bollinger positioning is tight as well. Price closed at 120.24, near the lower band at 120.39, suggesting the stock leaned soft into the close rather than building immediate upside traction.
Timeframe Conflict Suggests Consolidation Risk
Therefore, the timeframes are not fully aligned. The daily chart argues for a constructive bias in Allianz stock because trend structure and momentum remain positive. However, the hourly chart shows momentum fading, while the 15-minute chart reflects active short-term pressure.
That conflict usually points to consolidation or a shallow pullback rather than a clear directional break. On the other hand, a decisive loss of support would shift the interpretation quickly.
Allianz Stock Price Levels to Watch
From a price-level perspective, the market is trading around an important decision area. The daily and hourly pivot point sits at 120.78, with resistance at 121.33 and support at 119.70. Since Allianz stock closed below the pivot and below R1, buyers need to reclaim 120.78 to restore short-term control.
A push back through 121.33 would strengthen the bullish case. It would also reopen room toward the daily upper Bollinger area near 123.20.
Bullish and Bearish Scenarios for Allianz Stock
Bullish case
The bullish scenario remains valid as long as the stock holds above nearby support and stabilizes quickly. A recovery back above the pivot, followed by acceptance above 121.33, would suggest the current weakness is only a pause within the broader uptrend.
In that case, the daily trend alignment and still-positive daily MACD would matter more than the softer intraday readings.
Bearish case
On the other hand, the bearish scenario would gain traction if Allianz stock loses 119.70 and fails to reclaim the pivot area. That would confirm that hourly momentum deterioration is feeding into a deeper retracement.
It would not automatically reverse the daily uptrend, since price still sits well above the major daily EMAs. However, it would invalidate the near-term bullish continuation case and shift focus toward a broader consolidation phase.
Dividend Interest Supports Sentiment, but Price Must Confirm
There is also a fundamental near-term backdrop in the form of dividend interest, with recent coverage highlighting Allianz ahead of its ex-dividend window. That can help support sentiment around the stock.
However, the chart currently shows that Allianz stock still needs to prove buyers are willing to defend the recent advance rather than simply rely on yield support.
Allianz Stock Outlook
Overall, Allianz stock remains constructive on the daily timeframe, but the near-term tape has lost momentum. Positioning now hinges on whether buyers can reclaim the 120.78 to 121.33 zone, or whether weakness extends through 119.70. Until one side takes control, volatility looks manageable, while directional conviction remains reduced.