

Soitec stock keeps a constructive medium-term bias, with the daily chart still anchoring that view. Price remains above the 20-day, 50-day, and 200-day EMAs, so the broader trend structure stays positive even as near-term momentum begins to cool.
Summary
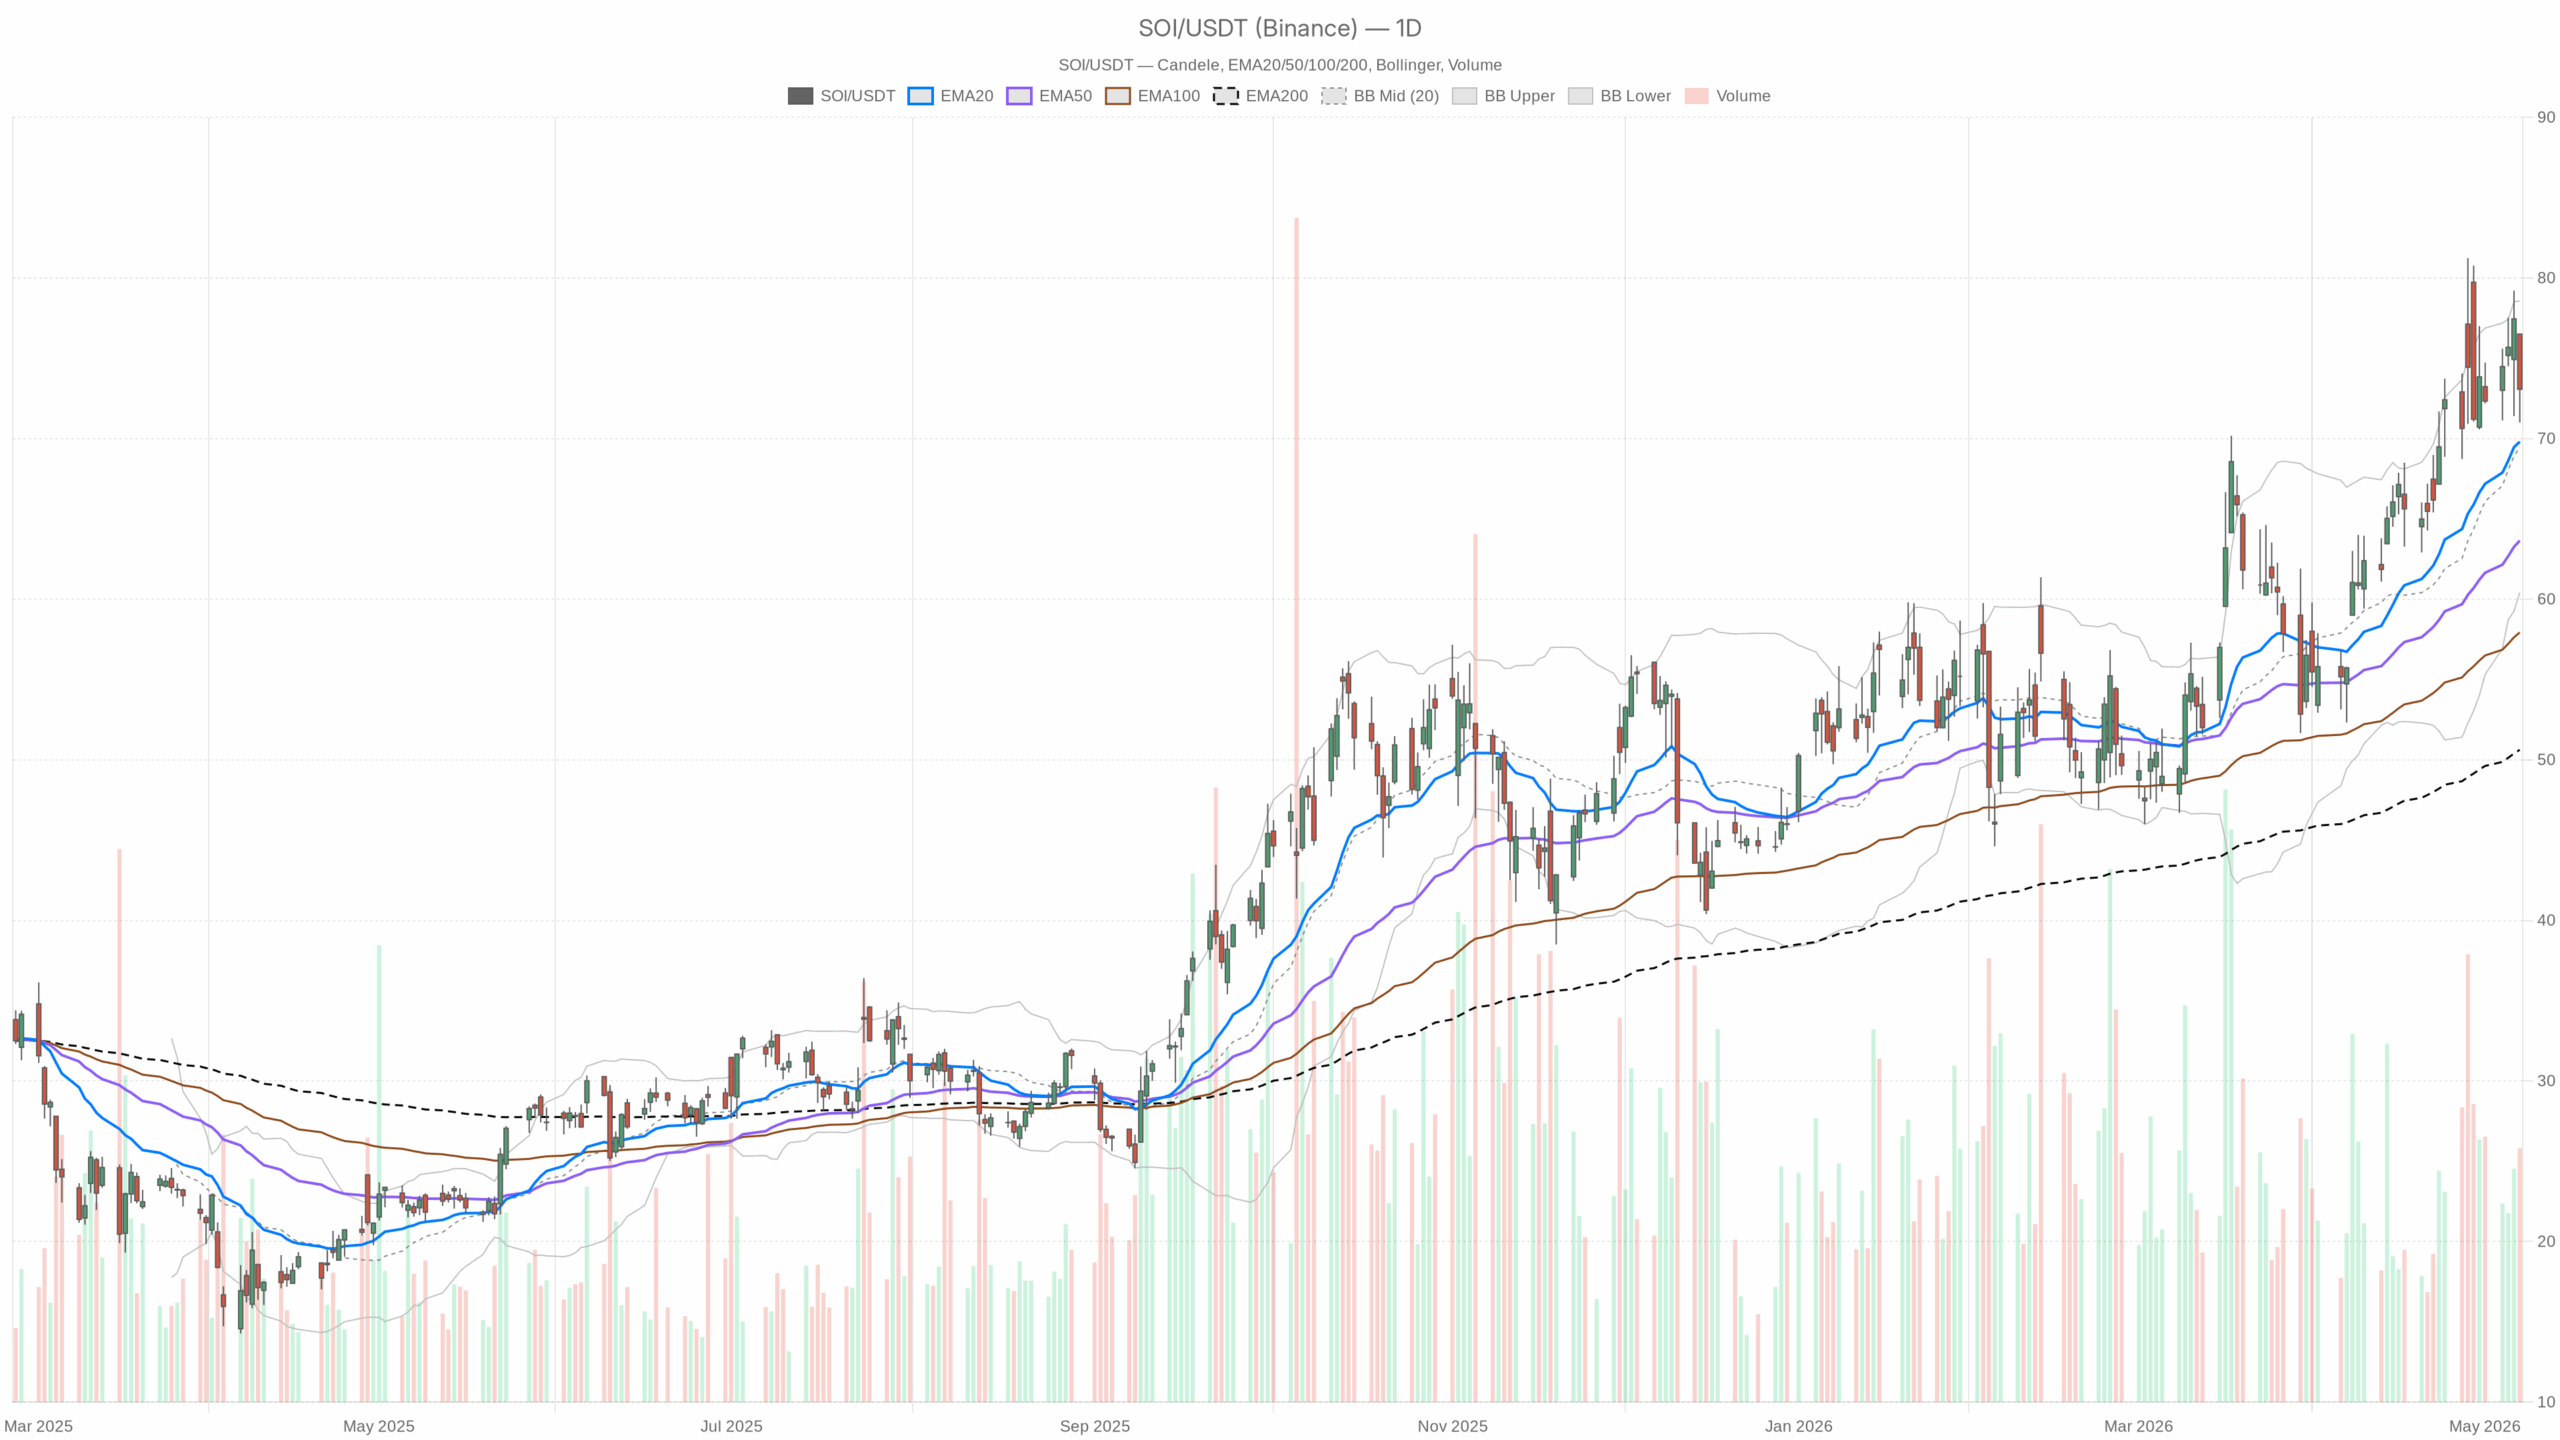
Soitec stock daily trend remains constructive
Soitec stock closed at 73.07, above the 20-day EMA at 69.81, the 50-day EMA at 63.64, and the 200-day EMA at 50.62. That keeps the broader trend firmly positive. In plain terms, buyers still control the primary trend despite the latest pullback from the session high.
Notably, the daily regime remains bullish, but the latest candle was not especially clean. The stock opened at 76.5, traded down to 71, and settled below the daily pivot at 73.52. It also closed under R1 at 76.05 and only modestly above S1 at 70.55. Therefore, intraday control weakened near resistance, even though the wider trend has not been broken.
Daily momentum stays positive
RSI on the daily chart stands at 59.12, which is constructive without being stretched. That suggests upside momentum remains intact, but not at an extreme. At the same time, MACD stays positive. The line at 4.09 remains above the signal line at 3.86, with a positive histogram of 0.24.
That keeps the medium-term trend backed by positive momentum. However, the margin is not especially wide. The signal still supports the bullish view, but it also leaves room for slower price action.
Volatility keeps pullbacks sharp
Bollinger Bands on the daily chart show price holding above the mid-band at 69.49 and below the upper band at 78.56. This suggests Soitec shares are advancing within the upper half of the recent range, but have not yet moved into a true breakout extension.
Meanwhile, daily ATR at 5.46 shows volatility remains elevated enough to allow sharp swings. In practice, trend-following remains valid, but entries are unlikely to be smooth.
Hourly Soitec stock chart shows fading thrust
The hourly chart broadly confirms the bullish daily bias, though with an important complication. Price at 74.48 remains above the 20-hour EMA at 71.9, the 50-hour EMA at 66.28, and the 200-hour EMA at 55.69. That confirms the short-term trend is still higher.
However, hourly RSI stands at 70.06, which points to a stretched condition near the top of the recent move. In short, the trend is positive, but the stock is no longer cheap on a short-term basis.
Momentum divergence on the hourly timeframe
Hourly MACD weakens the otherwise constructive picture. The MACD line remains positive at 2.72, yet it sits below the signal line at 3.16. The histogram is also negative at -0.45.
That usually reflects fading upside momentum rather than a confirmed trend reversal. Therefore, the daily uptrend remains valid, but the hourly move is losing thrust and may need consolidation before another leg higher.
Resistance zone narrows the setup
Hourly Bollinger Bands reinforce that message. Price is close to the upper band at 74.94, while the hourly pivot is 74.78 and the market closed slightly below it at 74.48. R1 stands at 75.3 and S1 at 73.96.
This leaves Soitec stock in a narrow decision zone just under short-term resistance. Buyers are still active, but they are no longer pressing with the same conviction seen earlier in the move.
Short-term timing remains constructive but not explosive
On the 15-minute chart, the setup is more about timing than direction. Price at 74.48 is above the 20-period EMA at 74.09 and the 50-period EMA at 73.12. It also remains far above the 200-period EMA at 65.5. That keeps the immediate tape constructive.
RSI at 55.75 is neutral to mildly positive, while MACD is slightly positive, with the line at 0.49 above the signal at 0.41. This tells us the very short-term bounce is still alive. Still, it is not explosive.
Soitec stock outlook: bullish bias with near-term consolidation risk
Therefore, the main scenario remains bullish, led by the daily chart. The trend structure is healthy, momentum is still positive on the higher timeframe, and price continues to trade above all major daily moving averages.
Still, the hourly chart warns that upside follow-through may not be immediate. The combination of an overbought hourly RSI and a weakening hourly MACD argues more for consolidation or choppy continuation than for a clean vertical breakout.
Bullish continuation levels
The bullish scenario would strengthen if Soitec stock decisively reclaims the daily pivot at 73.52 and pushes back through the hourly pivot at 74.78. From there, the next levels to challenge are 75.3 and 76.05.
A sustained move through that zone would bring the daily upper Bollinger area near 78.56 into focus. That would suggest the recent hesitation was only a pause within a broader uptrend.
Bearish risk levels to watch
In contrast, the bearish scenario starts to build if the stock continues to fail around the 74.78 to 76.05 resistance band and slips back toward 73.96, then 70.55. A break below daily S1 at 70.55 would matter more than hourly weakness alone.
That would signal that the short-term loss of momentum is starting to damage the daily structure. It would not fully reverse the long-term trend. However, it would clearly invalidate the near-term bullish continuation case.
Overall view on Soitec stock
Overall, Soitec stock still looks like a bullish chart with late-stage short-term fatigue rather than a bearish reversal. Positioning remains sensitive to volatility, with daily ATR high enough to produce wide swings around key pivots.
As long as price holds above the daily trend averages, the broader bias stays constructive. Even so, near-term traders should expect more friction and less one-way momentum unless resistance is cleared convincingly.