

Intel Stock extends its advance as momentum cools near resistance while volatility stays high. The bias remains bullish for INTC, though consolidation looks likely. Therefore, the path of least resistance is higher, with gains arriving in steps rather than surges.
Summary
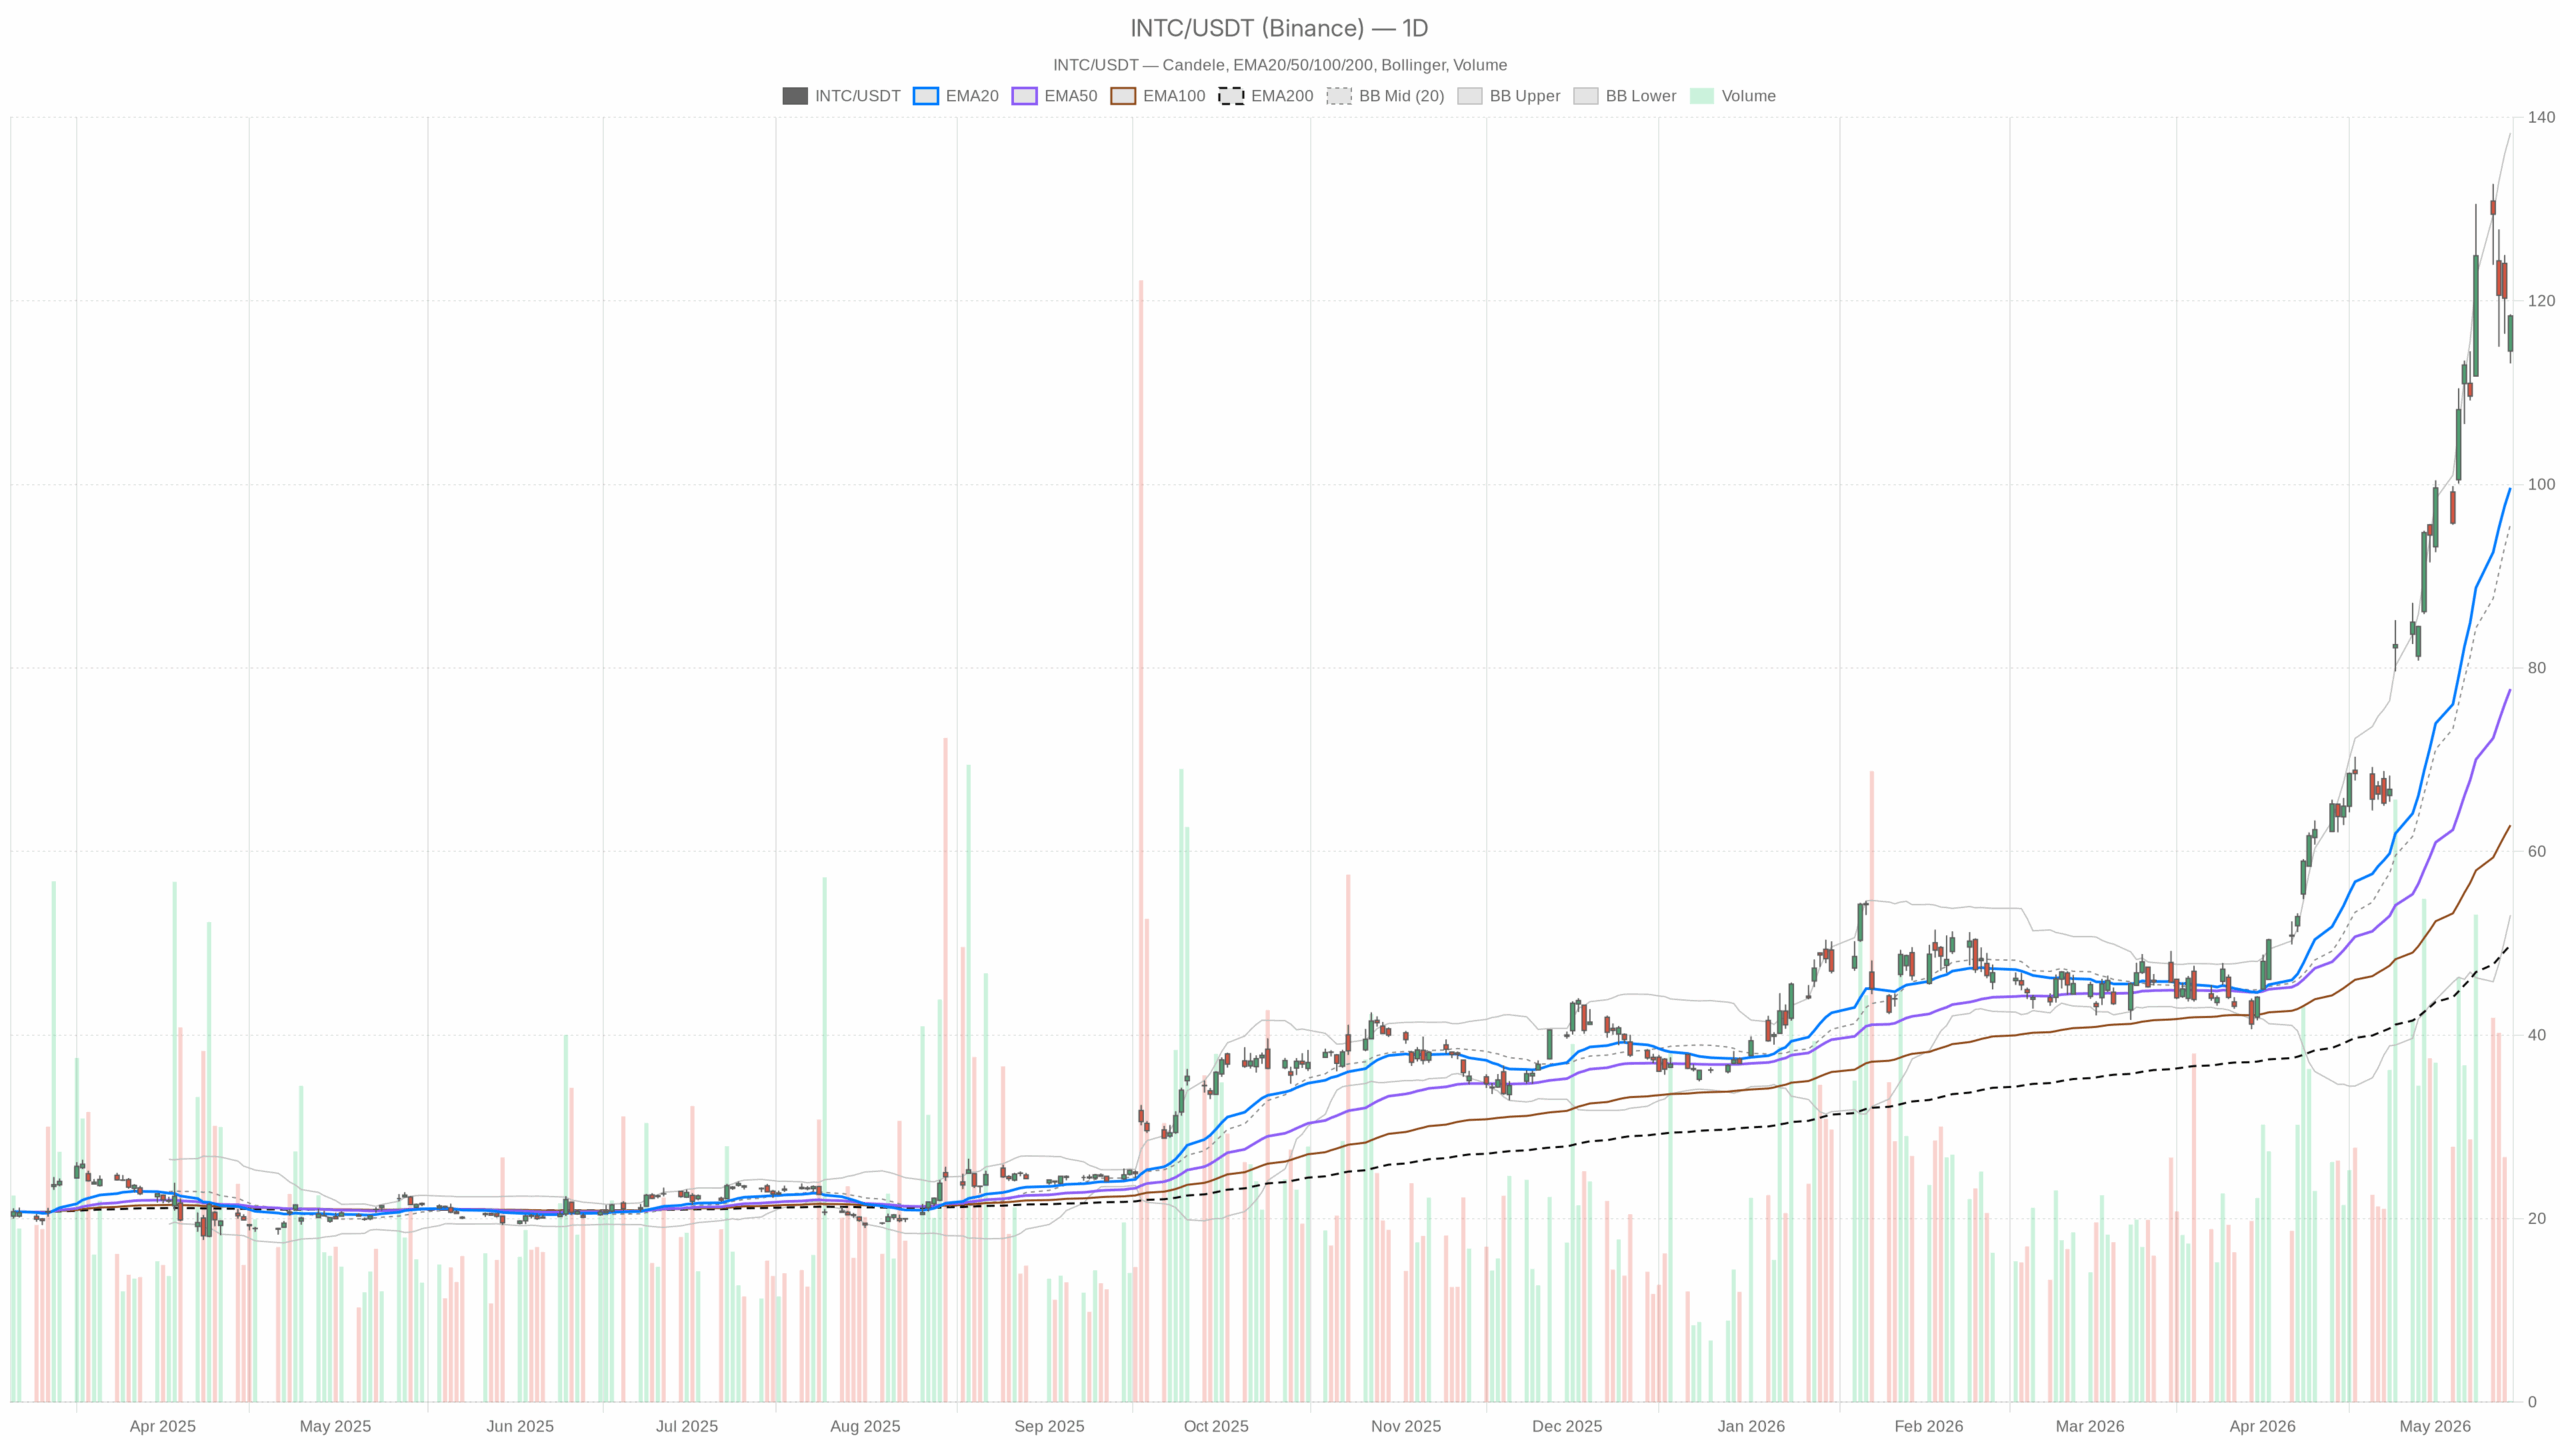
Intel Stock technical outlook — daily chart
On the daily timeframe, Intel Stock closed at 118.36, near the session high and above the pivot at 116.69. The 20/50/200-day EMAs at 99.63/77.71/49.82 sit well below price, confirming a strong, mature uptrend.
Momentum remains elevated. RSI(14) prints 72.44, which is hot and stretched. Meanwhile, MACD shows the line at 16.45 versus a 14.90 signal with a +1.55 histogram, keeping upside momentum in charge.
Volatility is expanded. Bollinger mid sits at 95.68, with the upper band near 138.29, leaving room before the top. ATR(14) is 8.74, so daily ranges are wide. Notably, R1/S1 are 120.21/114.85, making the 120 area the next hurdle and 114.85 the first cushion.
News and sentiment drivers for INTC
Notably, recent news flow has been supportive. Reports of exploratory Apple discussions around U.S. processor manufacturing and broader AI optimism helped spark the latest leg up. As a result, headline sensitivity is high and sentiment remains a tailwind for Intel Stock.
In contrast, a comparative piece favoring a peer on growth tempers exuberance. The relative narrative is mixed. However, today’s absolute drivers for INTC still look constructive, keeping the directional bias intact.
Intraday context — 1H trend digestion
The 1H timeframe shows a pause within trend. Price closed at 117.96, above the hourly pivot at 116.56 but below R1 at 119.94. Therefore, intraday support holds while resistance sits close overhead.
EMA placement underscores digestion. The 20/50/200-hour EMAs are 120.24/115.17/88.86. Price sits below the 20h but above the 50h, a routine pullback. RSI(14) is 46.36, now neutral. MACD shows 0.77 vs 1.44 with a -0.67 histogram, reflecting short-term negative momentum.
Meanwhile, Bollinger mid is 121.56 with the lower band at 113.82, placing trade in the lower half and signaling consolidation. ATR(14) is 3.21, so intraday ranges remain lively. Overall, 1H weakness does not break the bullish daily view.
Execution layer — 15m oversold into support
The 15m layer tilts oversold into support. Price printed 117.96 versus a 15m pivot at 117.90, trading on the intraday fulcrum. The 20/50/200-15m EMAs are 120.30/120.52/114.66, meaning price is below fast MAs but above the 200, a pullback within a larger uptrend.
Short-term pressure is evident. RSI(14) sits at 37.49, near oversold. MACD shows -0.35 vs 0.13 with a -0.48 histogram, a bearish impulse. Bollinger mid is 120.90 with a lower band at 118.29, and price dipped to 117.96. That slight lower-band breach increases bounce risk. ATR(14) is 1.27, so tactical ranges are manageable.
Multi-timeframe read and bias
The mix is clear: the daily trend is up, the 1H shows digestion, and the 15m is stretched to the downside. Consequently, the setup argues for a buy-the-dip bias within limits rather than chasing breakouts into nearby resistance on Intel Stock.
Scenarios and key levels for Intel Stock
Bullish scenario
A steady hold above 116.69 on the daily and 116.56 on the 1H keeps the trend intact. A rebound through 119.94 on the 1H and 120.21 on the daily would open another push higher. A daily RSI above 70 can persist in a strong trend, and continued positive MACD on D1 would back that advance. With ATR(14) near 8.74, sizable extensions are possible once 120 breaks.
Bearish scenario
On the other hand, a failure to reclaim 120 and a slip below 116.56/116.69 would shift risk toward 114.85. A daily close below 114.85 would dent the bullish case and put focus on the rising 20-day EMA at 99.63 as the next major level. Short-term, persistent 1H MACD weakness and trade below the 20h EMA would argue for a broader consolidation.
Risk, volatility, and positioning
At the same time, news remains a swing factor for the Intel stock price today. Supportive AI headlines and potential foundry partnerships can extend the trend, while relative comparisons within semis can cap near-term multiples. Therefore, headline risk should be respected.
Position sizing should match the elevated daily ATR and brisk 1H ranges. Overall, the bias is bullish with a consolidation overlay. Volatility argues for staggered entries around support rather than aggressive pursuit into resistance on Intel Stock.