

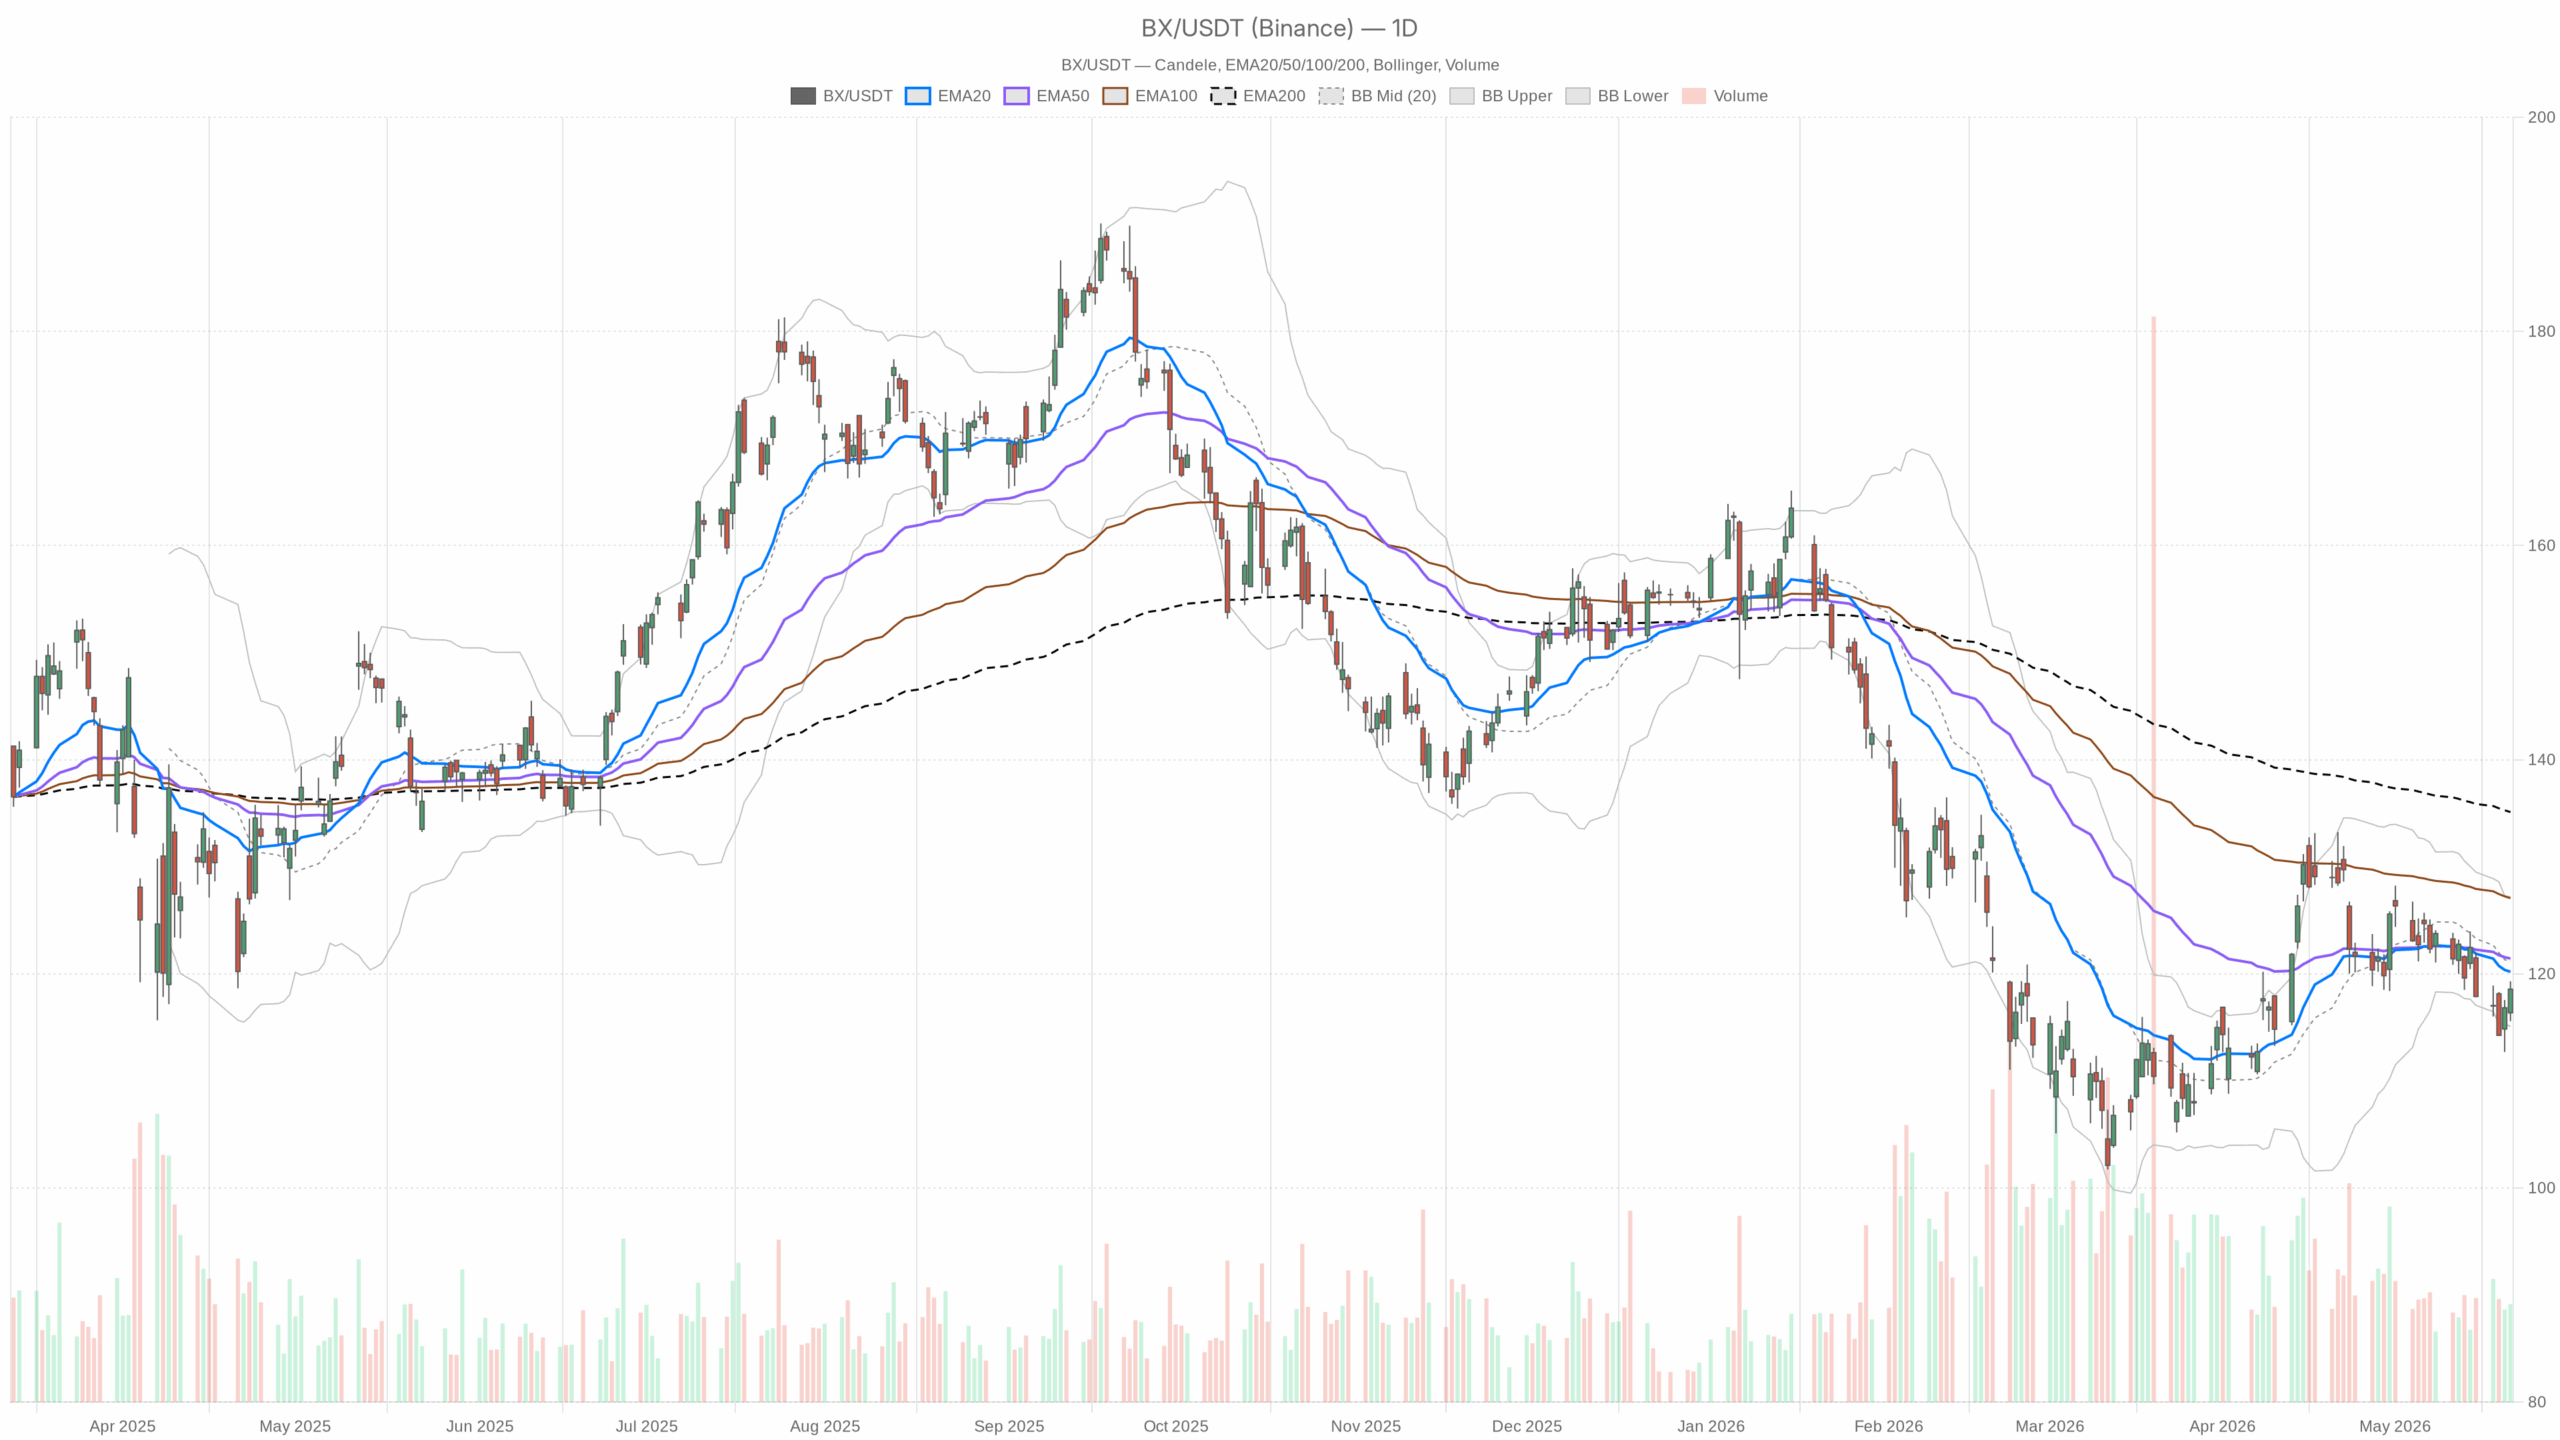
Blackstone Stock is rebounding intraday toward the 120–121 band, but the daily trend remains defensive. BX closed at 118.57 on May 21, with overhead supply near key averages. Momentum has improved short term, yet buyers must reclaim that zone to shift bias.
Summary
Blackstone Stock: Intraday strength vs 120–121 resistance
Intraday buyers pushed Blackstone Stock to 118.57 into the May 21 close, with overhead supply clustered near 120–121 where several moving averages converge. Short-term momentum has improved; however, the primary bias stays defensive until that zone is reclaimed on a closing basis.
Daily trend stays defensive below key averages
On the daily timeframe, BX finished below the 20-day EMA at 120.19 and the 50-day EMA at 121.44, while the 200-day sits up at 135.11. This alignment points to a medium-term downtrend. Therefore, rallies face supply until the 120–121 shelf is retaken.
Momentum and volatility on the daily chart
The daily RSI prints 46.98, a sub-50 reading that underscores lackluster upside drive. Meanwhile, the daily MACD shows the line at -0.98 versus a -0.10 signal and a -0.88 histogram, keeping downside pressure intact. A turn would likely start with a histogram improvement.
Daily Bollinger Bands place the mid near 121.14 and the lower at 115.08, with price below the mid. As a result, risk skews toward mean-reversion attempts capped by resistance. The ATR(14) at 3.71 signals wider day-to-day swings, where 2–3% moves can occur without a trend change.
Daily pivots show PP at 117.82, R1 at 120.06, and S1 at 116.33. BX sits near PP, with the first serious test at 120.06.
Hourly setup: improving tone within a downtrend
On the 1H chart, price is above the EMA20 at 117.27 and fractionally above the EMA50 at 118.34, while still below the EMA200 at 120.20. This structure signals a rebound unfolding within a larger downtrend.
The 1H RSI at 57.11 shows a modest bullish tilt. MACD has flipped positive, with the line at 0.02 versus a -0.42 signal and a +0.45 histogram. Hourly Bollinger Bands show a mid at 116.52 and an upper at 118.99; price is pressing the upper band, so upside may pause near 119 unless volatility expands.
The 1H ATR at 1.21 outlines a typical hourly range. Hourly pivots place PP at 118.42, R1 at 118.93, and S1 at 118.07. Therefore, price is consolidating just above PP with resistance close overhead.
15-minute execution context and nearby levels
On the 15-minute tape, price closed 118.57 with the EMA20 at 117.79 and EMA50 at 117.14 below, while the EMA200 sits near 118.44. The micro-trend is constructive but pressing into a thicker resistance layer.
The 15m RSI at 63.32 is firm, so short-term overbought risk is building. The 15m MACD shows a small positive histogram of 0.08, suggesting upside is slowing but not yet reversing.
Bollinger Bands center on 117.43 with an upper at 119.75; price sits in the upper half. The 15m ATR at 0.59 frames micro-volatility, where swings of roughly $0.60 are typical intraday. Pivots set PP at 118.45, R1 at 118.90, and S1 at 118.13, and dip-buying has shown up around 118.1–118.4.
News backdrop: AI infrastructure initiatives
Notably, the news tape is constructive even as the daily chart lags. Blackstone and Google announced a joint venture to build a U.S. AI infrastructure platform around Google Cloud TPUs, with Blackstone committing roughly $5 billion in equity. This leans into a secular AI capacity build that could support longer-term fee growth.
In addition, Blackstone Digital Infrastructure Trust (NYSE: BXDC) debuted to focus on hyperscale data centers. A Blackstone- and Anthropic-backed services firm also acquired Fractional AI. However, Blackstone Stock still trades below key daily averages, so catalysts need to translate into price before the bias turns.
Bullish scenario above 120–121
A bullish scenario hinges on clearing layered resistance. A sustained push and daily close above the 120.06 pivot R1 would be the first step, showing demand absorbing nearby supply.
Follow-through above the 20-day EMA at 120.19, the 50-day at 121.44, and the Bollinger mid at 121.14 would strengthen the case. Reclaiming 121 would flip the near-term trend and open room toward the daily upper band at 127.19. Confirmation would include the daily RSI crossing back above 50 and a MACD histogram moving toward zero.
Bearish scenario below 117.8–116.3
On the other hand, a bearish scenario reasserts if the rebound stalls beneath 120 and rolls over. A break below the daily pivot at 117.82, followed by 116.33 (S1), would put the lower Bollinger band at 115.08 in play.
On the hourly chart, an RSI slip back below 50 and a MACD rollover would confirm fading intraday momentum, signaling that the countertrend bounce is exhausted. The bullish setup would be invalidated by a daily close back under 116.33, resetting rallies as selling opportunities until new bases form.
Bottom line for Blackstone Stock
Overall, positioning around Blackstone Stock should respect the timeframe split: the daily bias is still bearish-to-neutral, while intraday flow is improving. The daily ATR at 3.71 warns that volatility remains elevated, so level discipline matters. Until 120–121 is reclaimed on a closing basis, rallies face supply; failure to hold 117.8–116.3 raises the risk of a slide toward 115. Headlines are constructive, but the tape has to confirm.