




Dell Stock remains in a powerful AI-fueled uptrend, but the daily setup is stretched. The next leg likely hinges on price behavior around the 318–326 pivot band and whether intraday momentum can re-accelerate into heightened volatility.
Summary
Dell Stock: Daily technical outlook
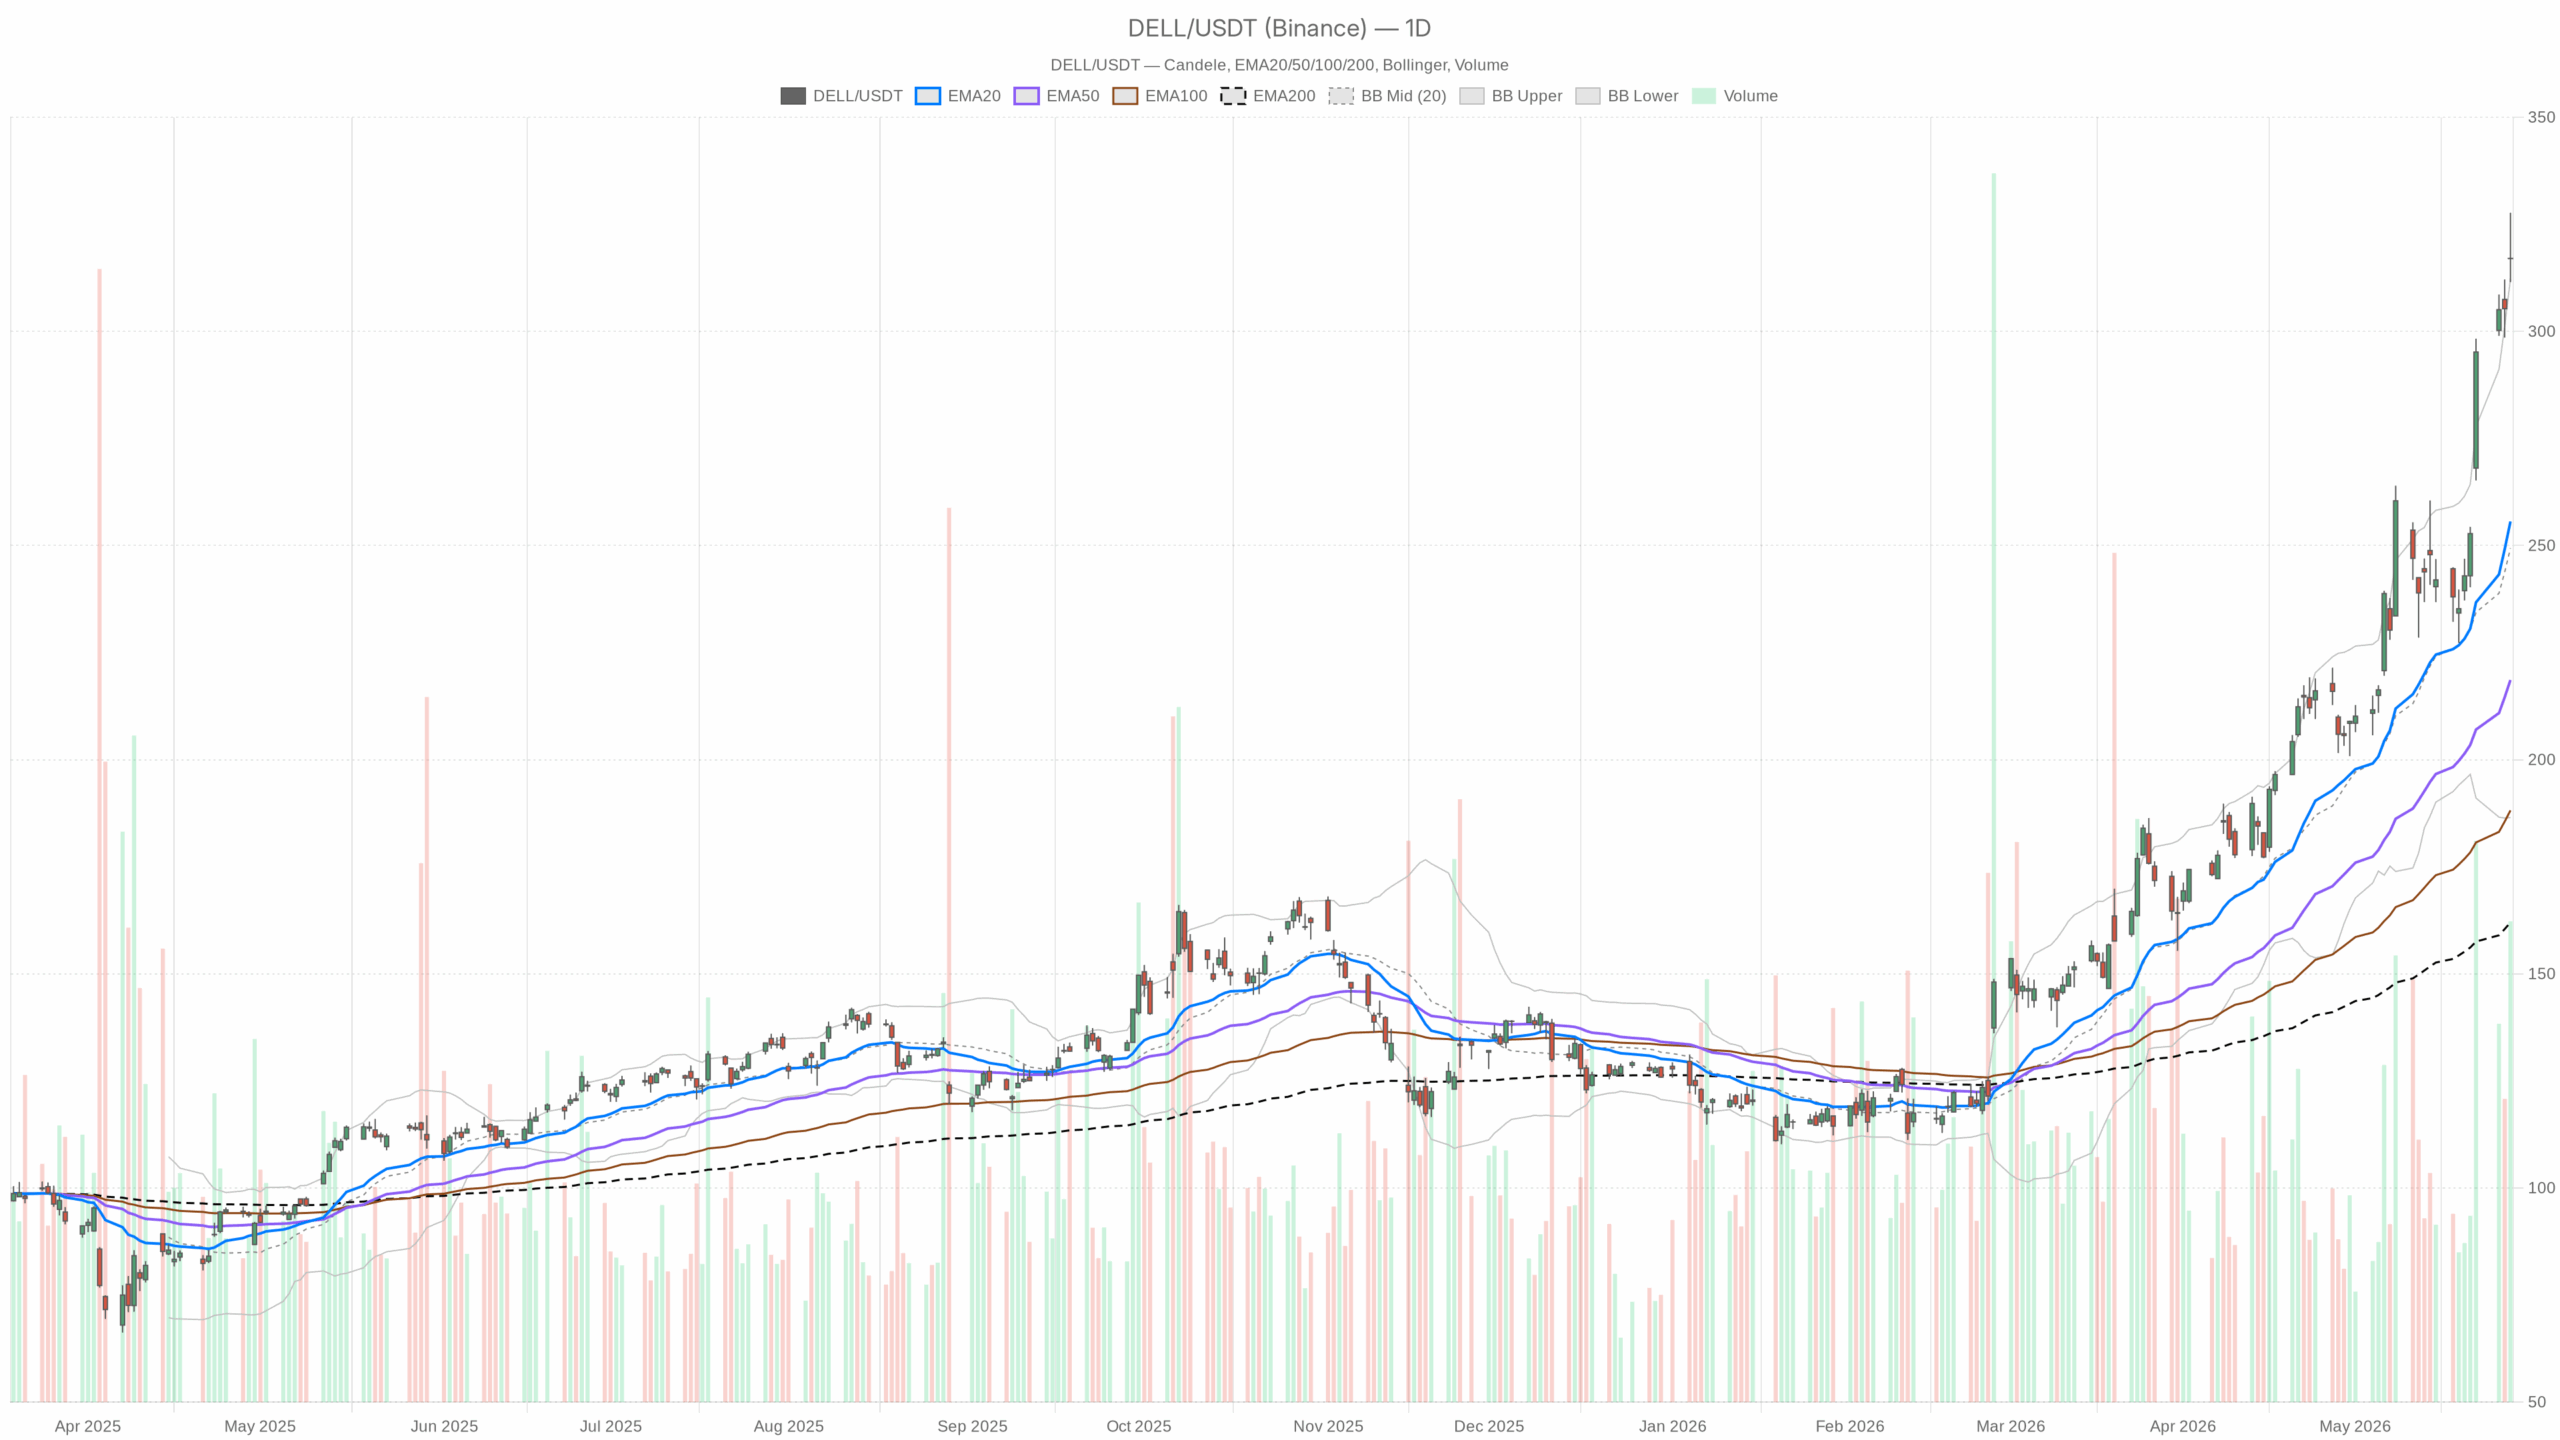
On the daily timeframe, DELL closed at 317.05 after a wide session. The 20/50/200‑day EMAs sit at 255.64/218.62/162.02. Trend leadership is unquestioned. However, price stands far above its moving baselines and is therefore extended.
The daily RSI(14) is 80.18, overbought and prone to pullbacks even in uptrends. Meanwhile, the daily MACD line at 25.95 versus a 19.67 signal with a +6.28 histogram shows positive momentum that has not fully rolled over.
Daily Bollinger Bands show a mid at 249.4 and an upper band near 312.3, with price above the upper band. Therefore, the trend phase is strong, but the risk of a snap-back toward the band is elevated. Daily ATR(14) is 18.41, underscoring wide ranges.
The daily pivot sits at 318.77 with R1 at 326.01 and S1 at 309.8. Notably, 318.77/326.01 is the near-term resistance corridor, while 309.8 is the first support of consequence for Dell Stock.
News backdrop and gap risk
The news backdrop is constructive. Dell topped Q1 earnings and revenue estimates with a +60.13% EPS surprise and a +23.62% revenue surprise, and raised its outlook on surging AI server demand. Fundamentals support the prevailing trend; however, management flagged component supply constraints that could inject episodic volatility.
Meanwhile, after-hours headlines pointed to a sharp jump in shares. Therefore, the open may feature gap dynamics and larger-than-usual swings in Dell Stock.
1-hour chart: bias and levels
On the 1‑hour chart, price last traded at 317.89 with the 20/50/200‑EMAs at 309.67/287.58/243.02. This intraday structure confirms the daily bullish bias.
The 1‑hour RSI(14) is 70.54—strong but edging toward overbought, consistent with late-stage intraday pushes. In contrast, the 1‑hour MACD line at 11.72 sits below its 12.63 signal with a ‑0.92 histogram, signaling cooled momentum and a pause or shallow pullback.
Hourly Bollinger Bands are centered at 311.55 with an upper band at 327.27. Price is consolidating just under resistance rather than accelerating. The 1‑hour pivot is 318.85 with R1 at 321.92 and S1 at 314.83. Trading slightly below the pivot signals hesitation; a reclaim would restore upside pressure.
Hourly ATR(14) is 6.26, so intraday ranges are wide and stops need air.
15-minute execution layer
At the 15‑minute execution layer, price printed 317.89 with the 20/50/200‑EMAs at 320.6/315.14/285.24. This is a minor pullback below the fast EMA, while the 50‑EMA still trends up as nearby support.
The 15‑minute RSI(14) is 46.09, neutral with a slight bearish tilt after the latest dip. The 15‑minute MACD histogram is ‑1.18, so micro momentum is negative and has not yet turned.
Short‑term Bollinger Bands are centered at 322.91 with a lower band at 318.21, and price slipped just under that lower band. Notably, such brief overshoots often invite a bounce attempt.
The 15‑minute pivot is 318.38 with R1 at 320.96 and S1 at 315.3. Therefore, 318.38/320.96 is the first reclaim zone for buyers; losing 315.3 hands control to sellers intraday.
Scenarios for Dell Stock
Bullish setup
The main scenario remains bullish on the daily timeframe, with trend strength but also extension. A firm reclaim of 318.8 on the 1‑hour and a push through 321.9 would refocus 326.0 (daily R1). Acceptance above 326.0 keeps the squeeze active and invites trend continuation.
On the daily chart, holding closes above the prior upper Bollinger area near 312 keeps the trend phase intact, avoiding a mean‑reversion signal. A 1‑hour MACD bullish cross and RSI holding in the 60–70 zone would corroborate renewed momentum. Dips toward the hourly 20‑EMA near 309.7 should attract buyers if the trend is healthy.
Mean-reversion setup
The bearish, or mean‑reversion, path emerges if price fails to reclaim 318.8 and then loses 314.8 on the 1‑hour. That sequence opens a test of 309.8 (daily S1) and the hourly 20‑EMA region. A decisive break of 309.8 would warn of deeper cooling.
A daily close back inside the Bollinger envelope, i.e., under roughly 312.3, would mark momentum fade and raise risk of a broader retrace. A retreat in daily RSI from 80 toward the mid‑60s would fit that path.
Risk management and session dynamics
Overall, Dell Stock retains a bullish daily bias, but it is stretched and volatile. Meanwhile, the 1‑hour loss of momentum complicates immediate follow‑through. At the same time, the 15‑minute oversold read leaves room for early bounce attempts around 318.
Positioning should respect the high ATR and the potential for gap‑and‑fade dynamics around AI‑driven headlines. Uncertainty is elevated; therefore, levels—not narratives—should guide risk as the session unfolds.
