

The Chainlink price today is hovering around 9.00, below the main moving averages: a context of bearish pressure with fragile rebounds. As long as 9.15 and especially 9.40 are not reclaimed, selling prevails. In addition, Bitcoin dominance at 57.2% and Fear & Greed at 29 signal struggling altcoins.
Summary
Multi-timeframe context: main trend bearish, weak intraday, 15′ driven by sellers
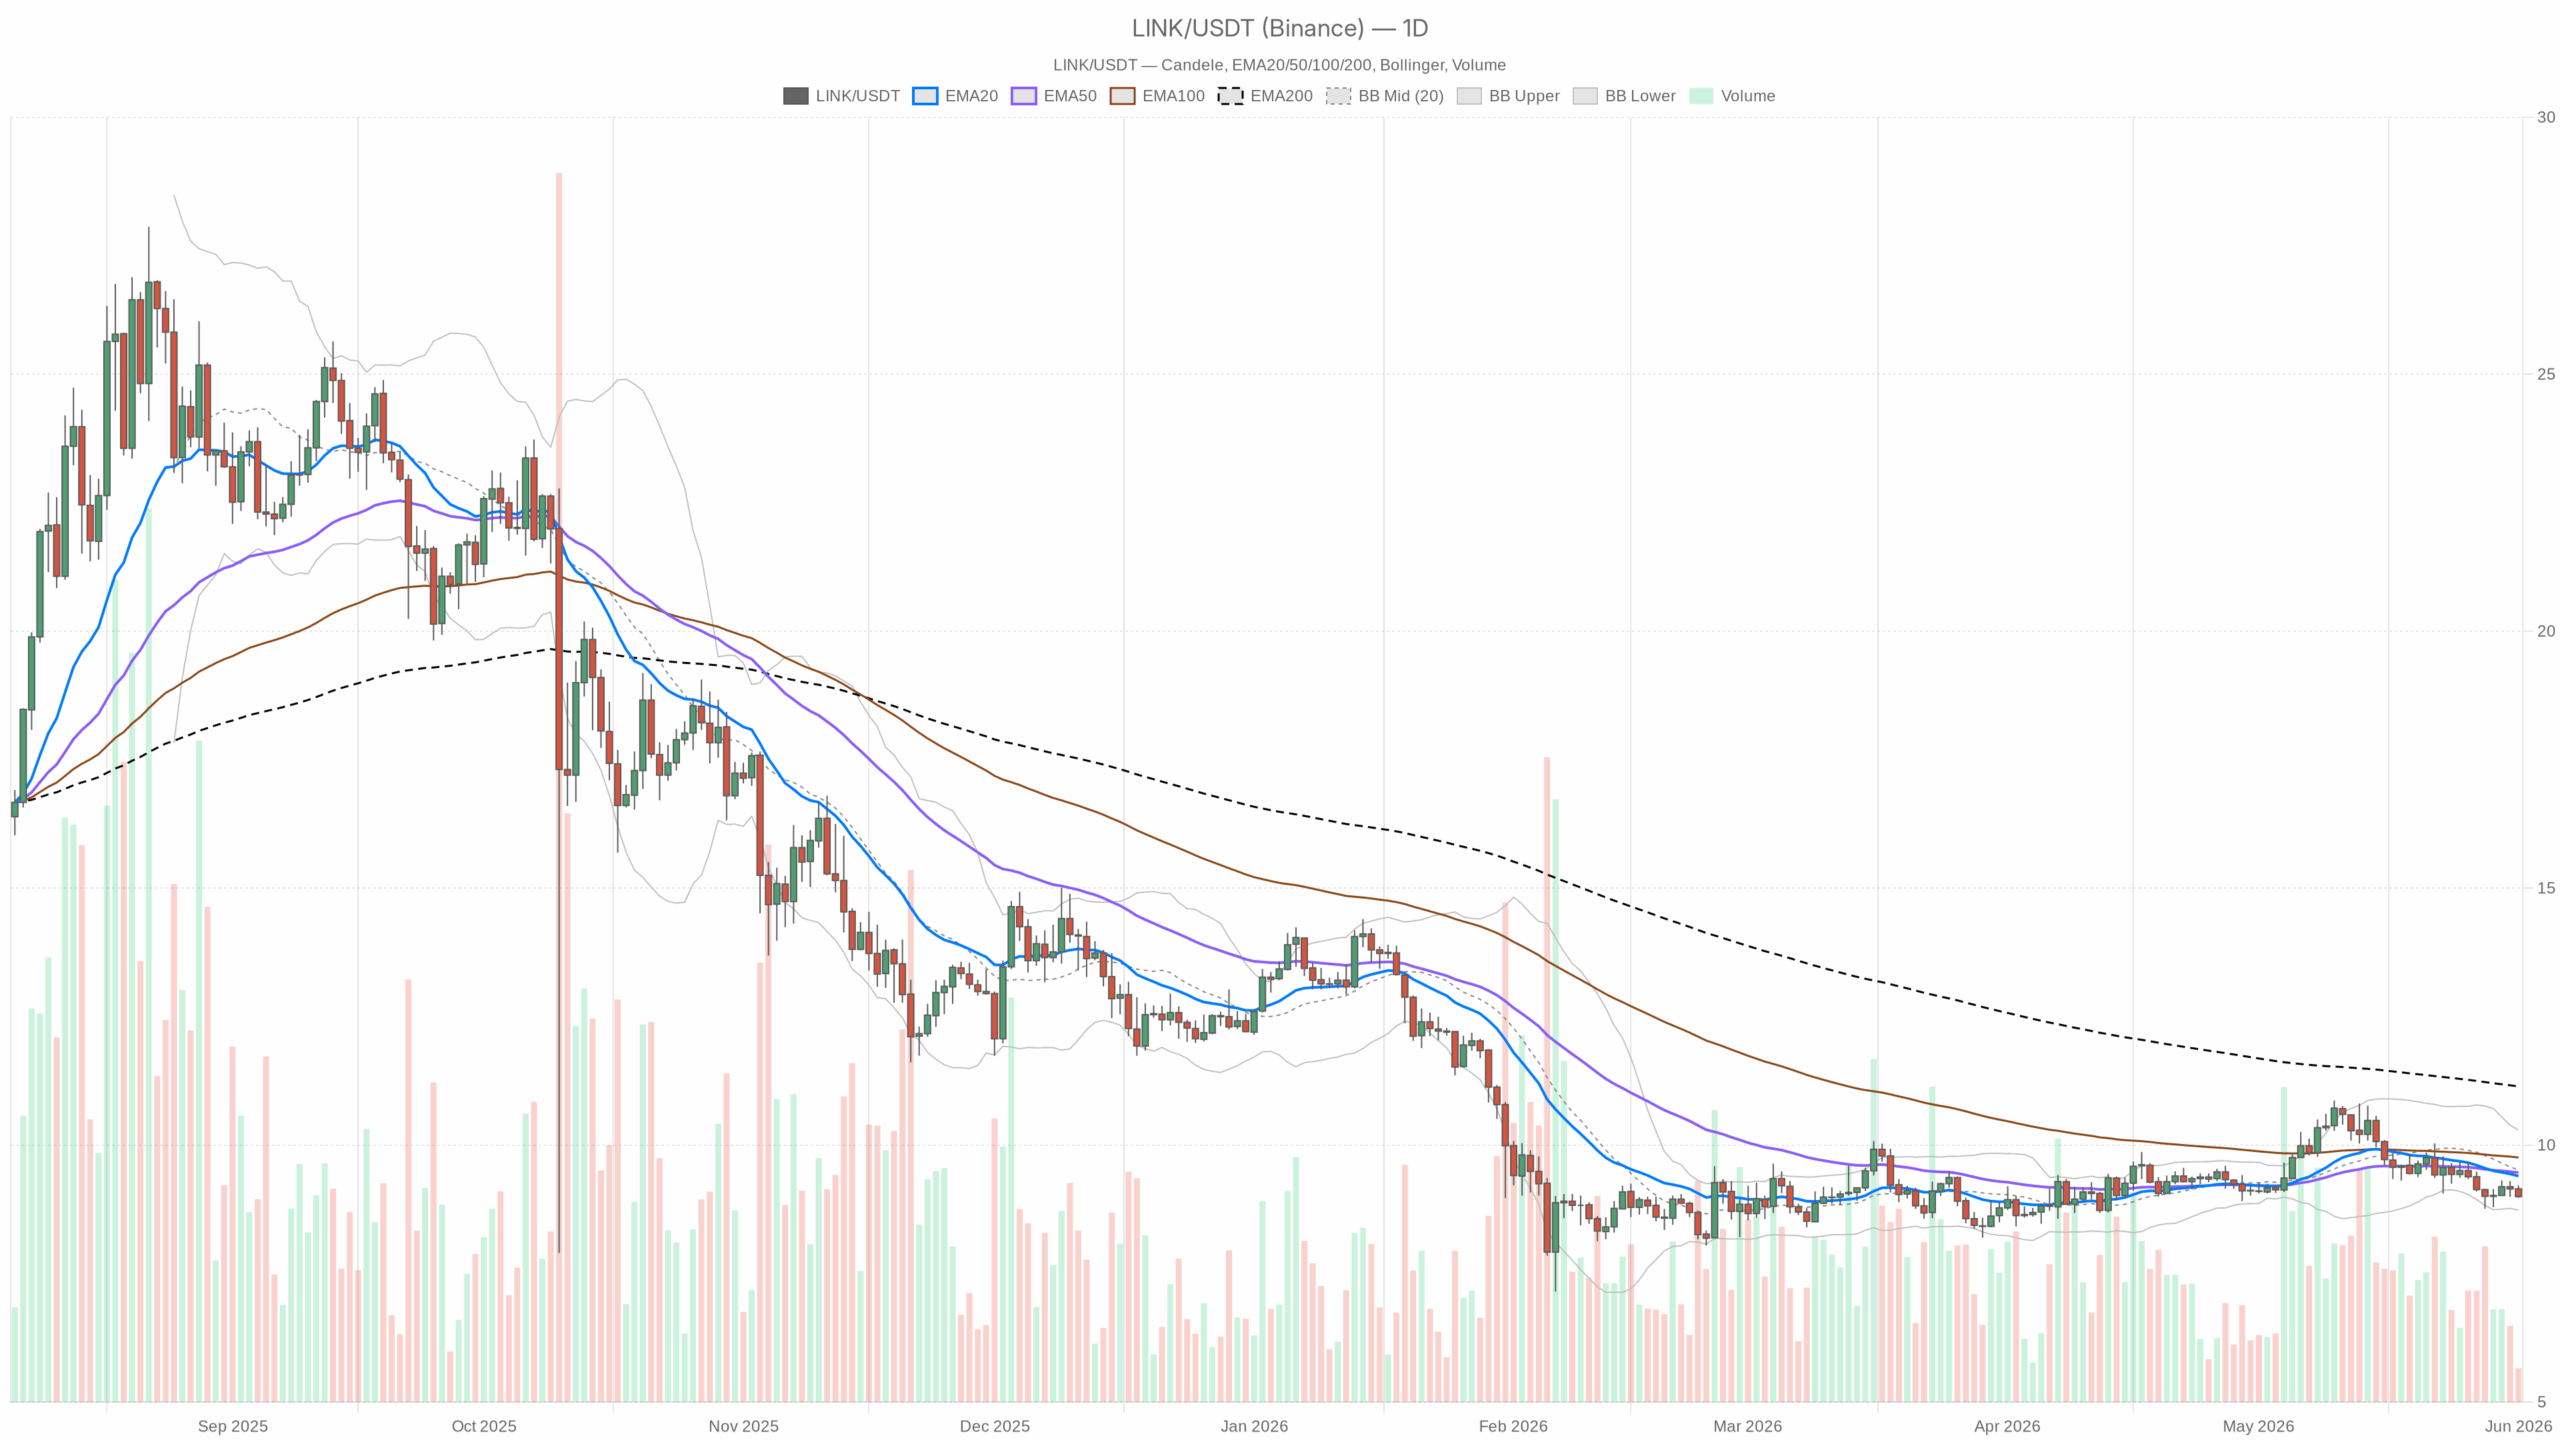
Daily (main direction): close 9.00 below EMA20 9.40, EMA50 9.47 and EMA200 11.14; RSI14 at 39.2 and MACD negative; Bollinger Bands with mid at 9.52 and lower band at 8.74. Active bearish picture: buyers, for now, have no leverage.
1H (confirmations/weakening): close 9.00 below EMA20 9.11, EMA50 9.14 and EMA200 9.24; RSI14 38.6; MACD just below zero; lower band at 8.98. Also here, momentum remains weak: rebounds towards 9.08–9.15 tend to fade quickly.
15′ (operational context): close 9.00 below EMA20 9.06, EMA50 9.10, EMA200 9.13; RSI14 37.0 and MACD slightly negative; lower band at 8.95. However, the micro-trend is sell-the-bounce: spikes below 9.00 attract stops, but there is no follow-through buying.
Key levels and price behavior
- Area 9.00: psychological level and intraday pivot (PP h1 9.01; S1 8.98). It is a flow magnet: brief breaks below 8.98 often bounce, but without a stable reclaim above 9.06 they remain traps for impatient buyers.
- 9.06–9.15: daily PP 9.06 and daily R1 9.15, in confluence with 1H EMA. This is the first acceptance zone to reclaim to talk about relief. As long as it rejects, sellers keep the timing.
- 9.40: daily EMA20. This is the real trend test: only above this level does the market show the ability to reverse the sequence of lower highs/lows.
- Supports: 8.98 (S1 1H), 8.91 (daily S1) and 8.74 (daily lower band). Losing/acceptance below 8.98 opens room towards 8.91 and, if pressure continues, towards 8.74.
That said, the Chainlink price remains compressed between 8.98 and 9.15: only above 9.40 does the market show a real reversal of the sequence of highs and lows.
What the metrics suggest (as supporting evidence)
EMA (20/50/200 on D1 and H1): the price is below all three and the alignment is downward. This implies selling on rebounds until there is a close above 9.40.
RSI (D1 39.2; H1 38.6; 15′ 37.0): values below 40 consistent with weak momentum. There is room for brief technical rebounds, but without lasting strength.
MACD (D1 negative, H1 slightly negative): below zero and with histogram in red. Indicates orderly bearish pressure: squeezes trigger, but tend to be sold.
Bollinger Bands (D1 mid 9.52; low 8.74 | H1 low 8.98 | 15′ low 8.95): price in the lower half and near the intraday lower edge. Favors a return towards the short-term mean, with room for controlled downside.
ATR (D1 0.39; H1 0.08; 15′ 0.04): expected daily volatility ~4–5% and compressed intraday. Moves of $0.30–0.40 during the day are normal.
Pivots (D1 PP 9.06 / R1 9.15 / S1 8.91; H1 PP 9.01 / R1 9.03 / S1 8.98): cluster of levels between 8.98 and 9.15. Therefore, confirmation on hourly closes is needed.
Plausible bullish scenario
Progressive reclaim of 9.06 → 9.11 → 9.15 with hourly closes above 9.15 and holding on retests. In that case, likely extension towards 9.40 (D1 EMA20). If the market accepts above 9.40, room towards 9.52 and then 9.80–10.00. Invalidation: return below 9.00–8.98 after the recovery.
Plausible bearish scenario
Alternatively, a new rejection in the 9.06–9.15 area with breakdown below 8.98. Target 8.91 and, in extension, 8.74. Any short-covering spikes towards 9.10–9.20 are opportunities to reposition risk as long as hourly closes remain below 9.20. Invalidation: daily close above 9.40 with H1 stable above 9.20.
How to read the context now (as a trader)
The bias remains bearish: as long as LINK does not reclaim 9.15–9.40, it makes sense to sell rebounds towards moving averages and nearby resistances, with tight stops above 9.20–9.40. However, beware of false breakouts or breakdowns around 9.00 and 8.98: nearby bands favor opposite spikes before the real move.
For those following the Chainlink price in real time and today’s quote, this reading is based on the LINK/USD pair. For those looking at the value in euros, the level structure remains the same: only the exchange rates change. The chart suggests that, for now, the more cautious Chainlink price forecasts remain sideways-weak until confirmations return above 9.40. In summary, monitor 8.98–9.15 as the decision corridor and do not chase moves without confirmations.