

Oklo stock is navigating a clear tension between a credible long-term thesis and short-term momentum loss. Recent price action reflects this dynamic, with June 3rd’s sharp intraday reversal setting the tone for cautious near-term trading.
Summary
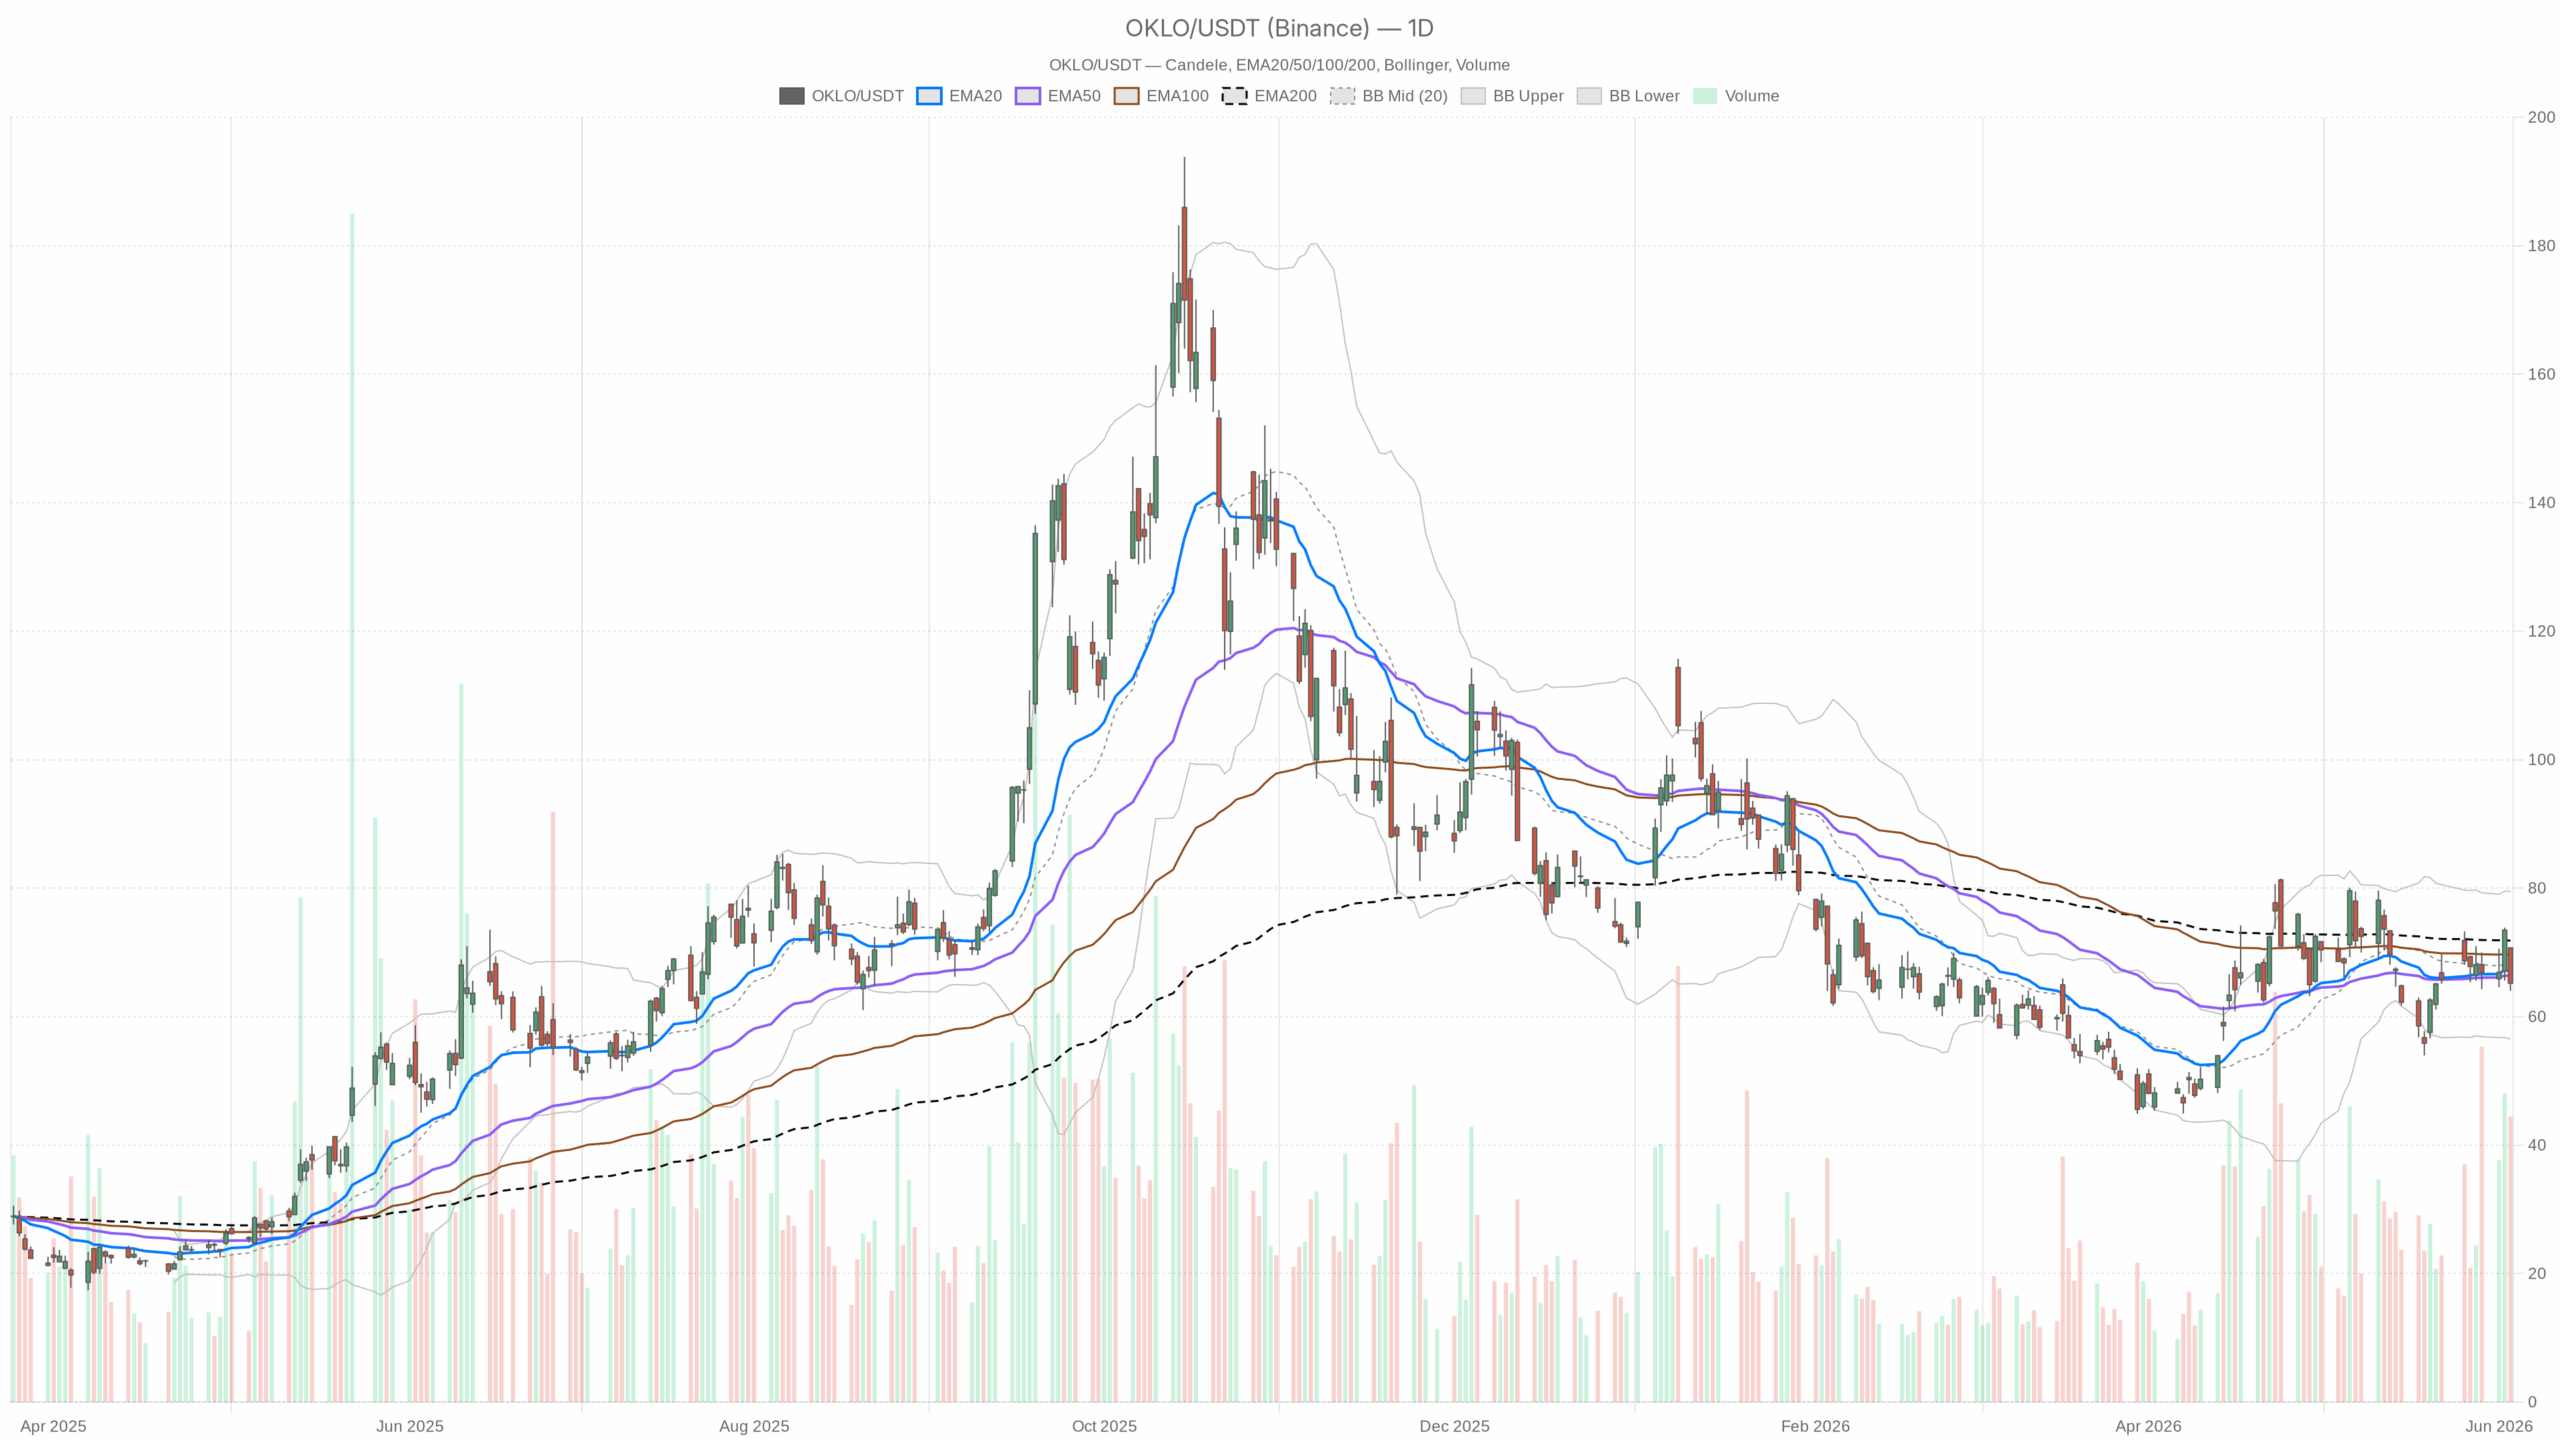
Oklo Stock Daily Chart: Neutral Bias with Bearish Undertones
On the daily timeframe, OKLO maintains a broadly neutral technical profile. The 20-day EMA at $67.09 remains above the 50-day EMA at $66.35, indicating an underlying bullish momentum structure. However, price has dipped below both EMAs, signaling a corrective phase rather than outright trend failure. The longer-term 200-day EMA at $71.84 remains well above the current $65.21 price, emphasizing ongoing medium-term structural pressure.
The daily RSI stands at 48.35, reflecting neither overbought nor oversold conditions. Concurrently, the MACD is essentially flat—line at 0.53, signal at 0.52, and histogram at 0.01—indicating stalled momentum. Such flatness suggests the prior bullish trend has paused, awaiting renewed buying interest or further selling.
Volatility and Price Range Analysis
Volatility is elevated, with the 14-day ATR at $5.96, indicating substantial daily price swings are normal for Oklo stock. The Bollinger Bands are relatively wide, with the upper band near $79.48 and the lower band at $56.51. Currently, price is positioned in the lower half of the bands, introducing a slight downward bias to the daily outlook. The daily pivot point at $66.66 acts as resistance, while the next significant support is at $62.60.
Hourly Chart Signals: Increased Selling Pressure
The hourly timeframe offers a more bearish perspective. Oklo stock trades below the hourly 20-EMA ($68.00), 50-EMA ($67.80), and Bollinger midline ($68.91). Only the 200-EMA at $66.08 provides minor near-term support, but it is insufficient given the broader negative momentum.
The hourly MACD reveals clear bearish momentum: the MACD line at -0.70 contrasts with the signal at 0.03 and a histogram of -0.73. Additionally, the hourly RSI at 40.71 nears oversold territory, suggesting the selling pressure could soon slow or briefly pause. The intraday pivot at $65.46 is critical; holding near this level would be a minimal prerequisite for any potential stabilization.
Short Term Intraday Nuance on 15-Minute Chart
Intraday signals on the 15-minute chart offer some constructive signs. The 15-minute RSI at 37.96 approaches oversold levels, while the MACD histogram has shifted positive at +0.20 despite the MACD line staying deeply negative at -0.82. This divergence implies that selling momentum is decelerating, presenting a cautionary setup for active traders.
Price compression near the lower Bollinger Band, set between $66.56 and $64.40, supports the notion of short-term exhaustion rather than immediate reversal. This subtle shift hints that further sharp declines may be limited in the very near term.
Oklo Stock Fundamental Context
Fundamentally, Oklo benefits from a bullish narrative supported by a recent analyst Buy rating with an $80 price target, about 23% above current levels. With commercial contracts involving Meta and Switch, Oklo is poised as a notable competitor in the AI energy infrastructure sector. The company’s advanced fission plant technology, backed by OpenAI’s Sam Altman, targets data center clients, reinforcing its structural growth story.
Despite this, the stock carries the highest short interest in the utilities sector. Institutional skepticism centers on valuation concerns given Oklo’s pre-revenue status. While elevated short interest can fuel a short squeeze on positive catalysts, it presently exacerbates selling pressure and downside risk.
Scenarios for Oklo Stock: Bullish and Bearish Outlooks
The bullish thesis depends on reclaiming the daily pivot at $66.66, followed by a sustained move above the 20-day EMA at $67.09. Success in these areas could drive a test of the resistance zone from $69 to $70, aligning with the analyst’s $80 price objective if regulatory and market conditions improve.
Conversely, a decisive break below the daily support at $62.60 would intensify bearish momentum. The subsequent target is the lower Bollinger Band near $56.51, which would erase recent quarterly gains. Hourly support at $64.94 is crucial; its failure could accelerate selling amid persistent high short interest.
Conclusion: Oklo Stock at a Technical and Sentiment Crossroad
Oklo stock finds itself at a pivotal juncture. The daily chart signals a neutral stance with a slight bearish tilt due to price below key moving averages and pivot. Hourly data confirms increasing selling momentum, while 15-minute indicators suggest short-term selling pressure may be easing.
Traders should recognize the high volatility environment and monitor the critical $64.90–$65.50 support cluster. Without a clear reclaiming of the daily pivot, the short-term path of least resistance remains downward. Ultimately, the next directional move hinges on fresh catalysts or a decisive technical breakout.