

With the Dogecoin price at $0.09 on June 15, 2026, the market is in one of the most ambiguous moments of recent months. The dominant daily trend says one thing, but the hourly behavior tells another. It is not a simple market, and those looking for clear signals risk exposing themselves on both sides.
Summary
Key points
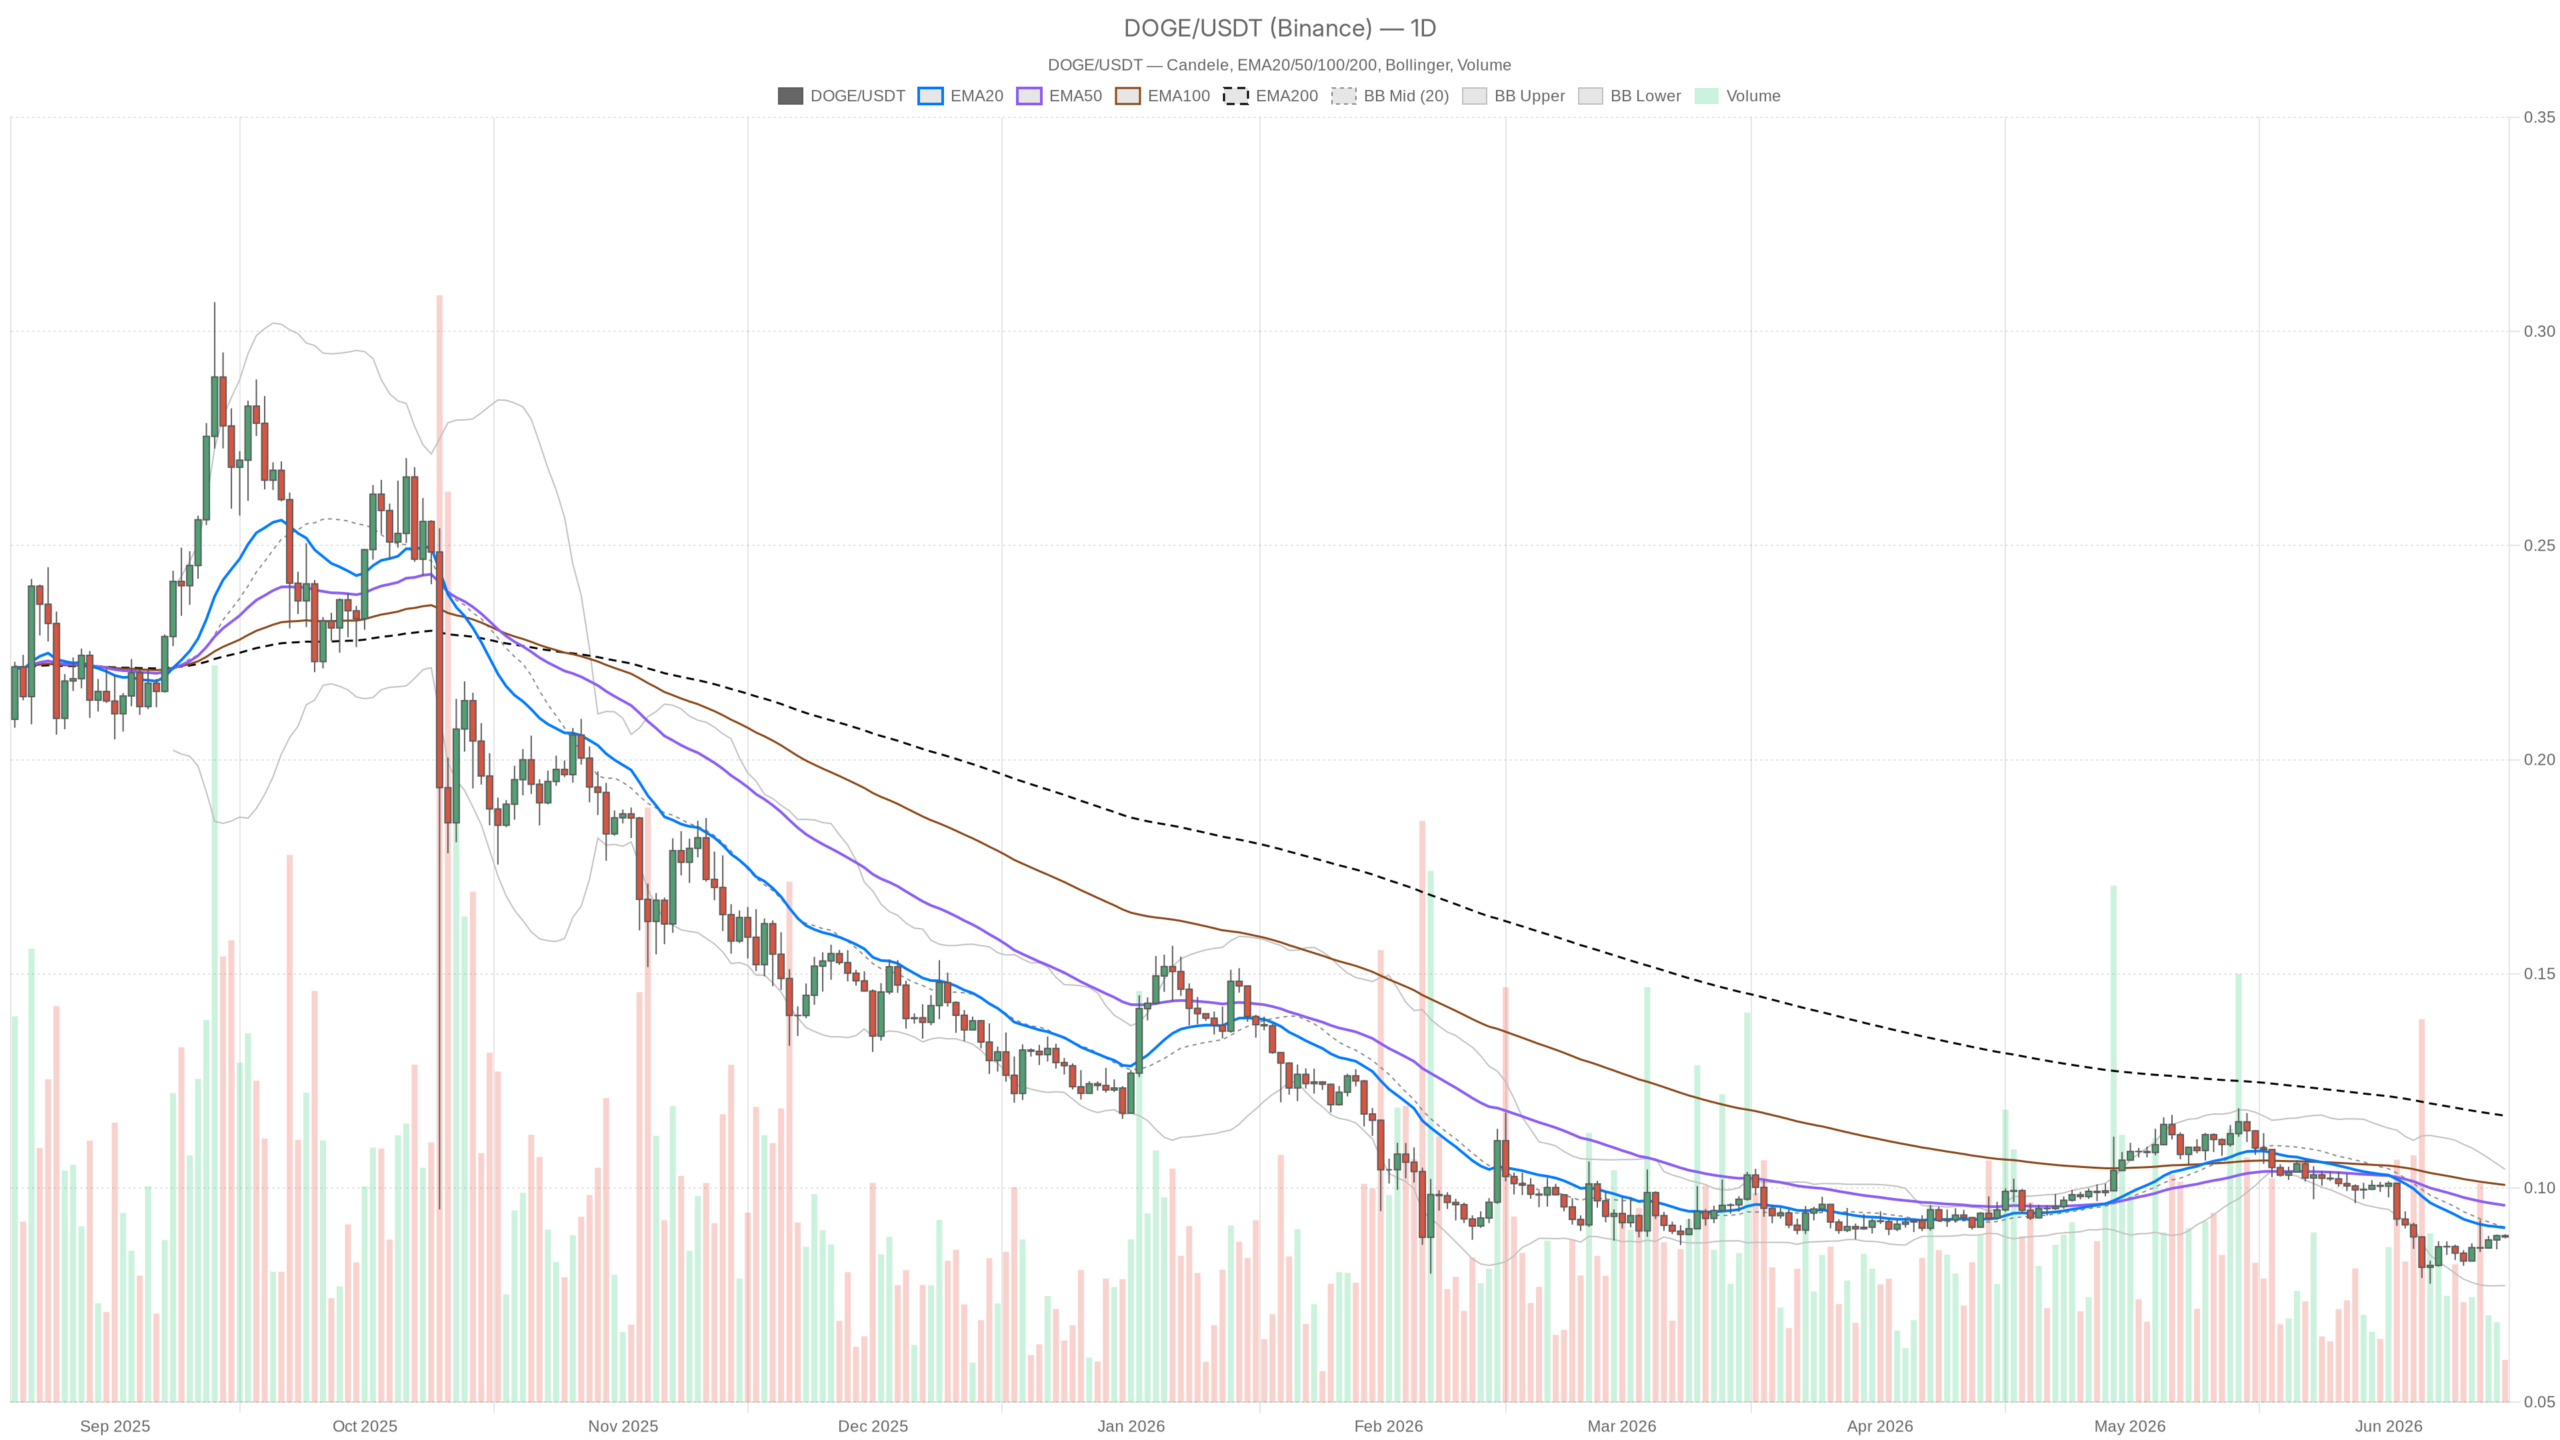
- Dogecoin is trading at $0.09 on June 15, 2026, below the three main EMAs: EMA50 at $0.10, EMA200 at $0.12.
- The daily regime is classified as bearish, with RSI at 41.44 and a flat MACD: no signal of an imminent reversal.
- The hourly timeframe shows a temporarily bullish signal (RSI 58.69), but not enough to reverse the daily structure.
- The Fear & Greed Index is at 20 (Extreme Fear), with Bitcoin dominance at 56.6%: an unfavorable context for altcoins.
- The compression of the Bollinger Bands and the convergence of the pivots at $0.09 indicate an unstable equilibrium, with a concrete risk of a false breakout.
The background picture: an asset under structural pressure
The thesis is clear: Dogecoin is in a phase of structural weakness. The daily chart certifies this with the regime classified as bearish, and the geometry of the exponential moving averages confirms it without any margin of doubt. The EMA20 has flattened exactly at the current price ($0.09). The EMA50 has already slipped to $0.10 — above the current price — and the EMA200 is even at $0.12. When the price travels below all three main moving averages, it is not a simple correction. It is a downward trend that has had time to structure itself.
In this context, every rebound should be treated with suspicion until proven otherwise. Dogecoin’s performance in recent months has drawn a series of recovery attempts, systematically stopped before gaining significant ground.
Daily momentum: energy running out
The 14‑period RSI on the daily chart reads 41.44. It is not yet in oversold territory, which means there is no technical signal of an imminent rebound due to exhaustion of selling pressure. The market still has room to fall without the oscillators screaming reversal. This reading discourages early buying attempts. Anyone buying Dogecoin today based on an RSI close to oversold is taking a risk that is not supported by the numbers.
Furthermore, the MACD on the daily is essentially flat, with line, signal and histogram all at zero. Absence of momentum, neither sharply bullish nor bearish: the market is tired, not in a directional explosion. This type of configuration tends to precede major moves, but does not anticipate the direction.
Bollinger Bands and ATR: compressed volatility
The Bollinger Bands on the daily show the upper band at $0.10 and the lower band at $0.08, with the price moving around the middle band at $0.09. The width of the bands is contained, and the 14‑period ATR reads $0.01 — about 11% of the current price. It is not explosive volatility, but it is enough to hurt in both directions if you enter without well‑placed stops.
The compression of the bands, combined with a flat MACD, is typical of phases of silent accumulation or distribution. However, determining which of the two is underway requires looking at what is happening on lower timeframes. And this is where the story gets complicated.
The 1‑hour timeframe: a small bullish anomaly
On the hourly chart, the regime is classified as bullish. The 1H RSI reads 58.69 — not overbought, but clearly in positive territory, with short‑term momentum showing a small vein of strength. The 20, 50 and 200‑period EMAs on the hourly are all aligned at $0.09, indicating recent stability without significant deviations from the average.
This 1H signal is not enough to reverse the daily reading, but it says that in the last session buyers have shown some presence. It is not a bullish trend: it is a local rebound that keeps Dogecoin anchored in the $0.09 area without letting it sink toward $0.08.
The 15‑minute chart: no clear direction
On M15 the regime is neutral, the RSI is at 47.78 and all the moving averages are compressed at the same level. The ATR is essentially at zero, which signals a price that at this moment is barely moving in the very short term. Consequently, those trading Dogecoin intraday today find a market that offers very few short‑term trading opportunities.
The pivots on all three timeframes are identical: PP, R1 and S1 all at $0.09. Such total convergence on a single price level indicates a market in unstable equilibrium — like a coin balanced on its edge. The next move, when it comes, could be abrupt.
The macro context: fear weighing on the market
According to aggregated market data, the Fear & Greed Index is at 20, in Extreme Fear territory. The total crypto market capitalization is about $2.32 trillion with an increase of 1.8% in the last 24 hours. In addition, Bitcoin maintains a dominance of 56.6% — a high level that historically tends to penalize altcoins like Dogecoin, which struggle to attract capital when investors prefer to take shelter in the largest asset by market cap.
In a context of extreme fear, altcoin rallies tend to be short and shallow. That said, anyone considering investing in Dogecoin at this time must reckon with a general sentiment that is not favorable to risk.
Bullish scenario: what is needed to change the picture
To be able to talk about a credible recovery in the Dogecoin price, several precise conditions would be needed. The first concrete signal would be a recovery and daily close above $0.10 — the level of the EMA50 — with increasing volume. That level is currently the first real structural resistance. Its breakout would invalidate the short‑term bearish pressure.
In addition, a second element would be the daily RSI moving back above 50, confirming that momentum has truly changed hands. In this scenario, the next target would be the $0.11–$0.12 area, where the EMA200 lies and where significant sellers would likely be found.
Invalidation level of the bullish scenario: a clear loss of $0.08 on the daily, which would open space toward price areas not covered by the recent technical structure.
Bearish scenario: the path of least resistance
The path of least resistance remains to the downside. The price below all the main EMAs, the flat MACD, the daily RSI far from oversold and a market sentiment in Extreme Fear build a coherent case for a continuation of weakness. The lower Bollinger Band at $0.08 is the first natural target in case the current equilibrium breaks down.
A daily close below $0.088 — with above‑average volumes — could act as a trigger for an acceleration toward that area. In that case, the next levels to monitor would be around $0.075–$0.07, areas that correspond to highs and lows of previous periods.
Invalidation level of the bearish scenario: a convincing daily close above $0.10 with momentum recovering on the MACD.
How to read this moment operationally
Dogecoin today is an asset to watch rather than attack. The conflict between a bearish daily and a temporarily bullish hourly is a classic trap for those trading short timeframes without considering the higher structure. The hourly rebound could continue a bit longer. However, without the daily confirming the regime change, every long position is essentially a bet against the dominant trend.
The most concrete risk at this moment is that of a false breakout: an acceleration toward $0.095–$0.10 that attracts buyers convinced they are witnessing a reversal, only to then retrace sharply below $0.088. This is a pattern that the Dogecoin market has already executed in the past during phases of silent distribution. The current compression of the Bollinger Bands makes it technically plausible.
Consequently, those who already have open positions should evaluate their stops taking into account an ATR of $0.01 as a minimum reference, to avoid being stopped out by market noise. Those considering new entries, whether long or short, would do well to wait for a daily close that clearly exits the current equilibrium zone — in one direction or the other — before taking on exposure. The Dogecoin price at this moment is not asking to be traded: it is asking to be respected in its ambiguity.
FAQ
Is Dogecoin in an uptrend or a downtrend?
As of June 15, 2026, the dominant daily trend is bearish. The price below the three main EMAs (20, 50 and 200), the RSI at 41.44 and the flat MACD confirm a phase of structural weakness. Only a daily close above $0.10 with increasing volumes could begin to invalidate this reading.
What are the key levels to watch for Dogecoin?
The critical levels are $0.10 (EMA50, primary resistance), $0.12 (EMA200, structural resistance), $0.09 (current equilibrium) and $0.08 (lower Bollinger Band, immediate support). A break below $0.088 with above‑average volumes would open the way toward $0.075–$0.07.
Why does the macro context penalize Dogecoin at the moment?
With the Fear & Greed Index at 20 (Extreme Fear) and Bitcoin dominance at 56.6%, investors tend to take shelter in the main asset, penalizing altcoins like Dogecoin. In these conditions, altcoin rallies are historically short and shallow.
{“@context”:”https://schema.org”,”@type”:”FAQPage”,”mainEntity”:[{“@type”:”Question”,”name”:”Is Dogecoin in an uptrend or a downtrend?”,”acceptedAnswer”:{“@type”:”Answer”,”text”:”As of June 15, 2026, the dominant daily trend is bearish. The price below the three main EMAs (20, 50 and 200), the RSI at 41.44 and the flat MACD confirm a phase of structural weakness. Only a daily close above $0.10 with increasing volumes could begin to invalidate this reading.”}},{“@type”:”Question”,”name”:”What are the key levels to watch for Dogecoin?”,”acceptedAnswer”:{“@type”:”Answer”,”text”:”The critical levels are $0.10 (EMA50, primary resistance), $0.12 (EMA200, structural resistance), $0.09 (current equilibrium) and $0.08 (lower Bollinger Band, immediate support). A break below $0.088 with above-average volumes would open the way toward $0.075–$0.07.”}},{“@type”:”Question”,”name”:”Why does the macro context penalize Dogecoin at the moment?”,”acceptedAnswer”:{“@type”:”Answer”,”text”:”With the Fear & Greed Index at 20 (Extreme Fear) and Bitcoin dominance at 56.6%, investors tend to take shelter in the main asset, penalizing altcoins like Dogecoin. In these conditions, altcoin rallies are historically short and shallow.”}}]}
Disclaimer: This article is for informational purposes only and does not constitute financial advice, investment recommendation or a solicitation to buy or sell financial instruments or cryptocurrencies. The analyses do not guarantee future results. Investments in crypto‑assets and financial markets involve a high risk of capital loss. Always do your own research (DYOR) and consult a qualified financial advisor before making any decision.
Content created with the assistance of artificial intelligence and with human editorial review.