

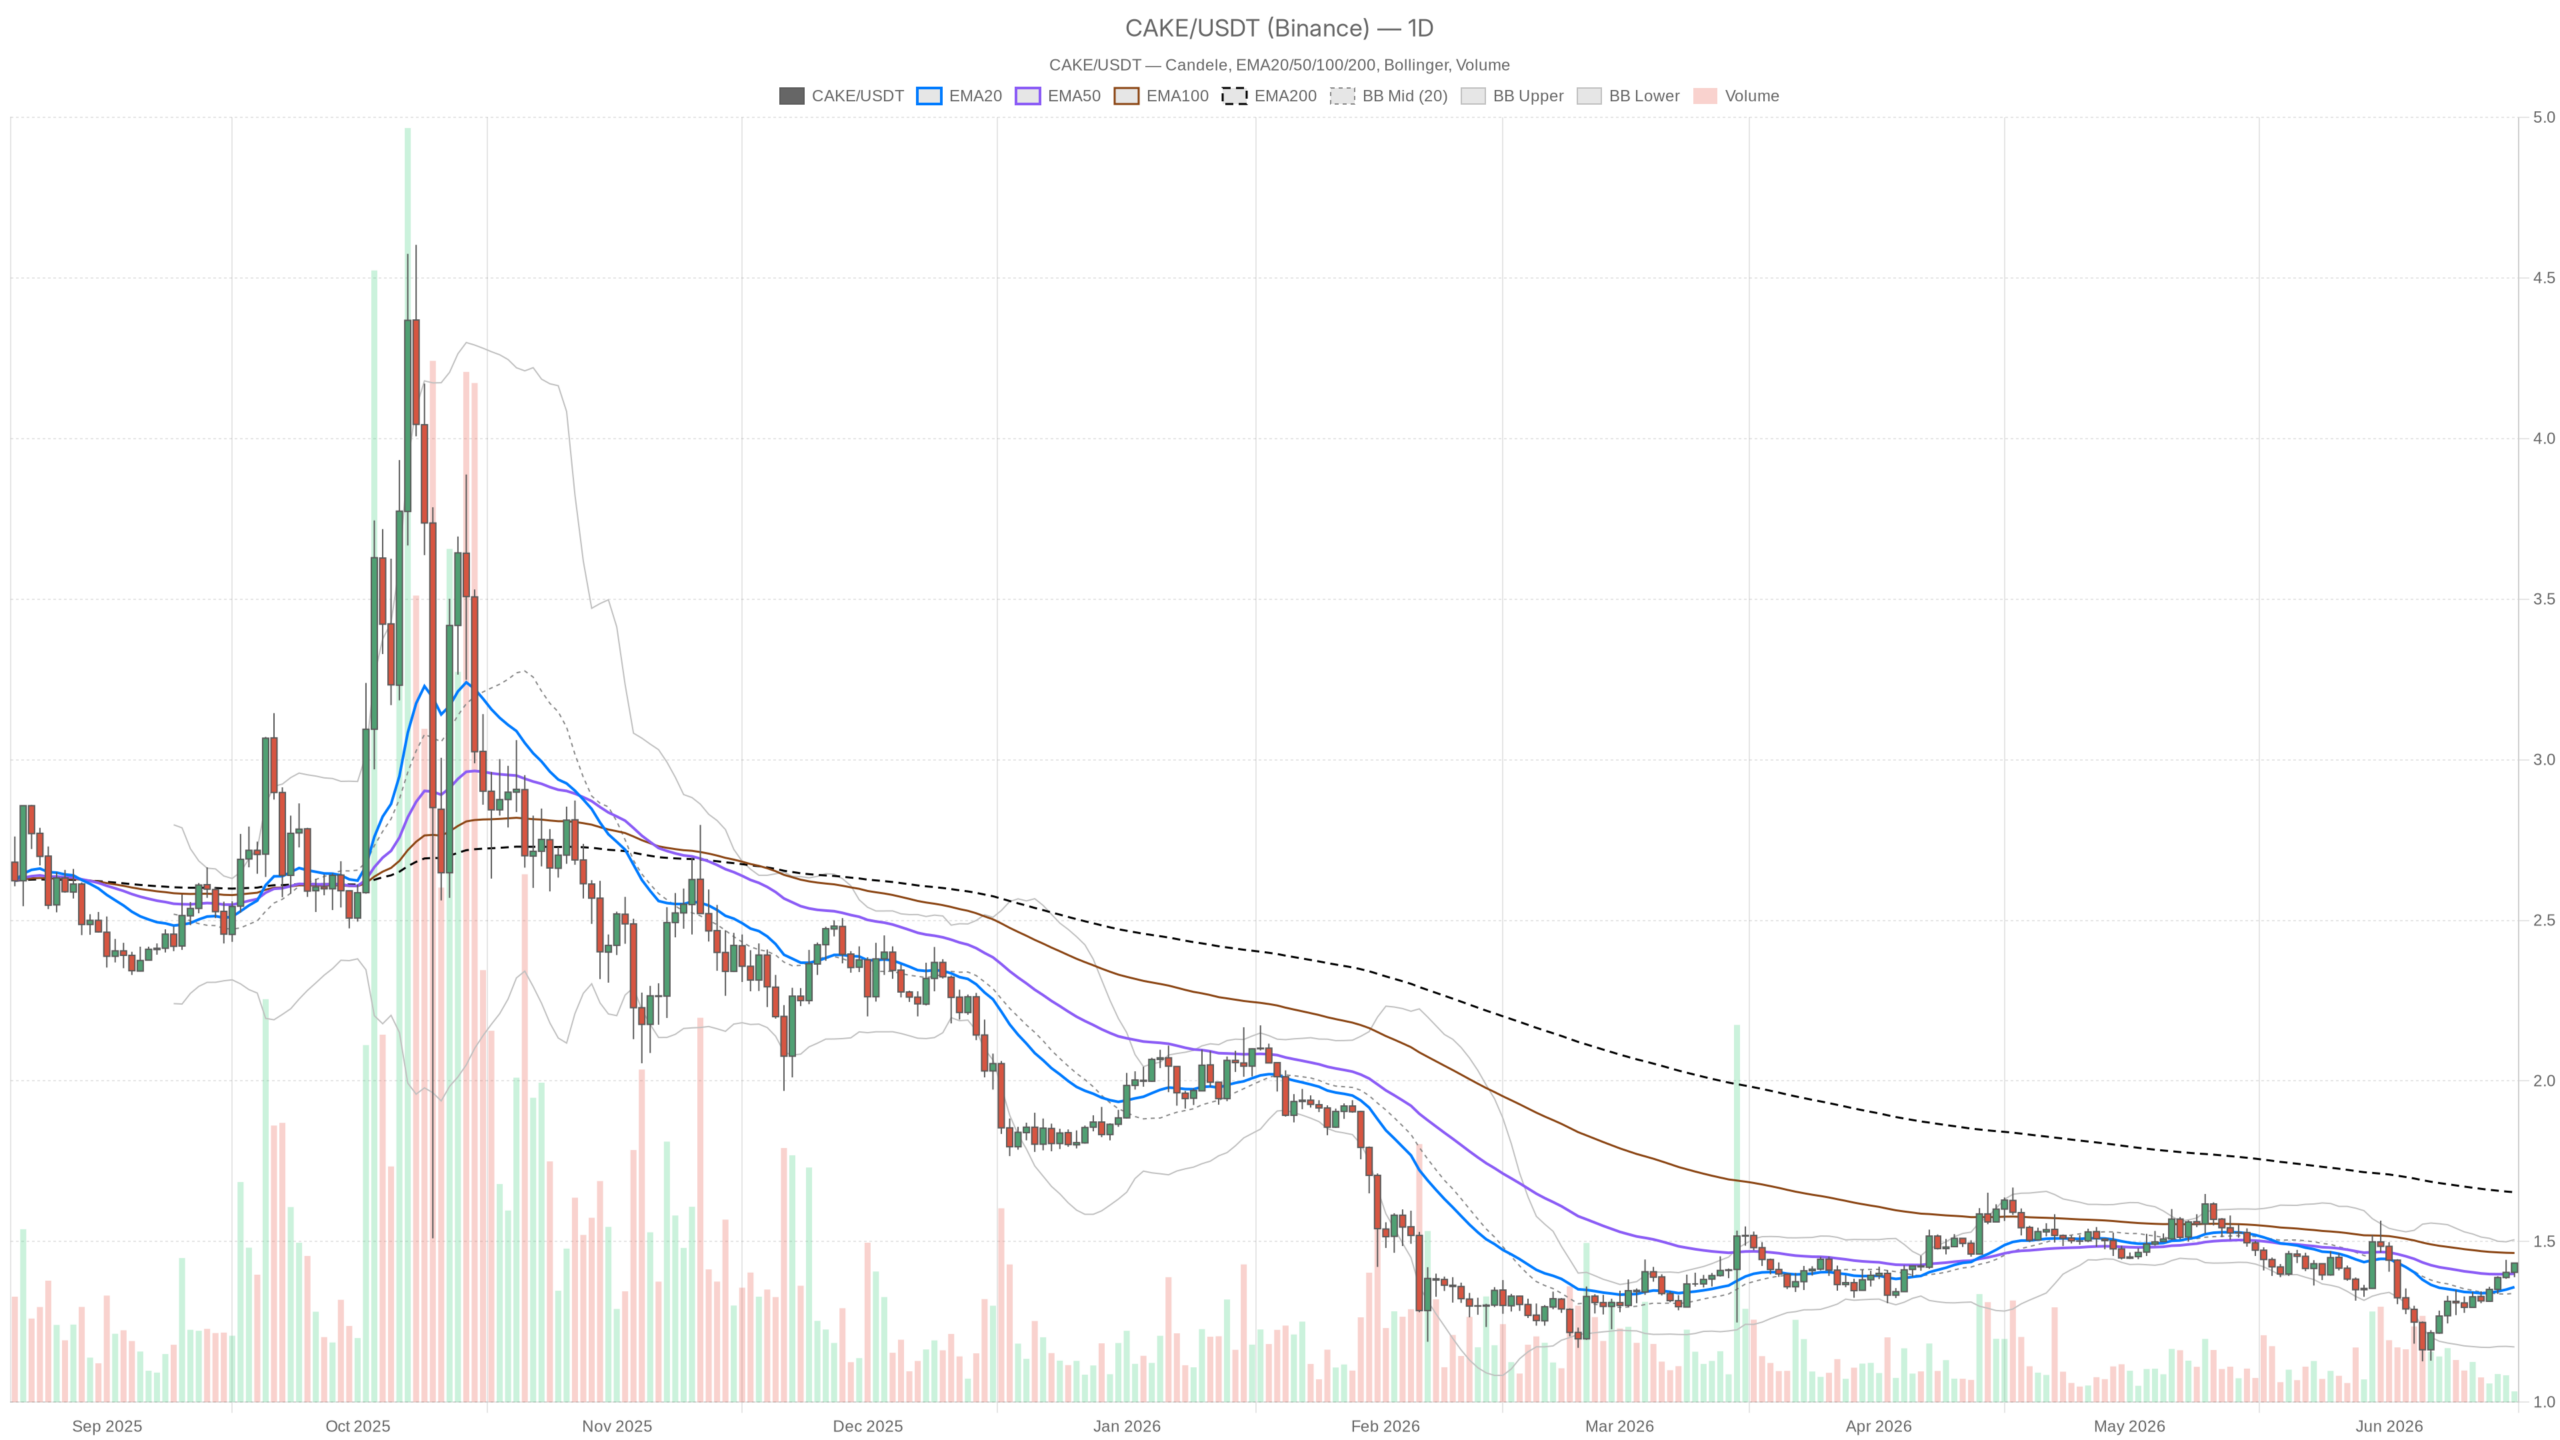
As of June 16, 2026, the PancakeSwap price stands at 1.43 dollars, exactly on the upper band of the hourly Bollinger Bands. CAKE has strongly recovered from recent lows, but remains well below the daily EMA200: the rebound is real, but the structural trend has not yet reversed.
Summary
Key points
- CAKE is trading at 1.43 dollars on the upper band of the hourly Bollinger Bands, with the daily EMA200 still 15% away.
- Daily RSI at 56.91 and MACD in crossover: bearish pressure is fading, but the daily regime remains neutral.
- Hourly timeframe is bullish with RSI at 65.29, but compressed bands signal an imminent directional move without indicating the direction.
- Pivot point and resistance at 1.44-1.45 represent the key level for the short term.
- Fear & Greed Index at 23 (Extreme Fear): the macro context is dampening appetite for speculative DeFi assets.
Daily picture: recovery, not yet a reversal
The daily picture of the PancakeSwap price tells the most honest story. The regime is classified as neutral: CAKE is trading above the EMA20 at 1.36 and the EMA50 at 1.40, both acting as dynamic support below the current price. However, the EMA200 at 1.65 is still almost 15% away. This means that the token has not recovered enough to speak of a structurally bullish trend. It is a recovery, not a reversal. The daily RSI at 56.91 confirms this: there is positive momentum, but we are far from an overbought zone. The market still has theoretical room before it needs to pull back, but it is not in explosive traction.
The daily MACD deserves a careful reading. The MACD line is slightly negative (-0.01), while the signal is even more negative (-0.03), with a positive histogram at +0.02: this indicates an ongoing crossover, i.e., a reduction in bearish pressure. It is not a clear-cut buy signal, but it suggests that selling is running out of steam on the main timeframe. A rising histogram, even from negative values, is often the first clue of a changing of the guard. The daily Bollinger Bands with an upper band at 1.51 and a lower band at 1.17 frame the potential range: the price is in the upper half of the band, but not yet compressed toward the top.
Lower timeframes: hot momentum and compressed bands
Moving to the hourly chart, the picture changes tone. The regime is bullish and the H1 RSI rises to 65.29, still technically below overbought but already in a hot zone. The short EMAs on this timeframe are all aligned below the price — EMA20 at 1.41, EMA50 at 1.39, EMA200 at 1.34 — forming a bullish stack that usually accompanies phases of clean intraday trend. However, the hourly MACD is flat, with a zero histogram: momentum is slowing. This is not necessarily a negative signal, but it indicates that the recent rally may need to consolidate before any further extension. The H1 Bollinger Bands are tight — upper band at 1.43, middle at 1.41, lower at 1.39 — and CAKE is stuck exactly at the top. Such compression often precedes a directional move, but does not determine its direction.
On the 15-minute timeframe the picture is even more extreme: RSI hits 70, a technical threshold that many traders use as a warning signal. It does not mean an automatic reversal, but it indicates that the short-term bullish move has used up much of its energy. The M15 MACD is completely flat (0/0/0) and the Bollinger Bands are compressed to the cent between 1.42 and 1.43. The price is trapped in a minimal range, with volatility — ATR14 at 0.01 on both H1 and M15 — practically absent in the immediate term. This is the kind of situation where waiting is wiser than forcing a trade.
Pivot points and trading levels
The pivot points complete the operational picture. On the daily chart, the main pivot is at 1.42, with R1 at 1.45 and S1 at 1.40: CAKE is exactly above the PP and still needs to convincingly break R1 to open room toward the upper Bollinger band at 1.51. On the hourly timeframe, instead, the pivot coincides with the current price (1.43) and R1 is at 1.44, a nearby resistance that could cap any short-term attempt to extend higher. The daily ATR at 0.07 indicates that average daily volatility is contained: do not expect sharp moves in the absence of external catalysts.
Macro context and trading scenarios
The macro context adds an element of caution that should not be underestimated. The Fear & Greed Index, according to aggregated CoinGecko data, stands at 23 — Extreme Fear. Total market capitalization has posted a positive change of just +0.36% over the last 24 hours, while Bitcoin maintains a dominance of 56.4%. In this environment, DeFi tokens like CAKE tend to underperform during risk-off phases: capital flows back into BTC and appetite for more speculative assets shrinks. This does not invalidate the technical reading, but it contextualizes it: a technical rebound in a market dominated by fear requires stronger confirmations before being treated as a trend.
Bullish scenario: if CAKE manages to break and close above 1.45 (daily R1) with strong volume, the next technical reference becomes the upper band of the daily Bollinger Bands at 1.51. Holding EMA20 and EMA50 as dynamic support would be the confirmation that the recovery has structure. This scenario is invalidated by a daily close below 1.40 (coinciding S1 and EMA50), which would signal the loss of key support and a potential return toward the 1.34-1.36 area.
Bearish scenario: if the price fails to break 1.44-1.45 in the next moves and short-term RSI starts to roll over, the risk is a pullback toward 1.40-1.39, an area where daily S1, H1 EMA50 and the hourly Bollinger midline converge. A break of that zone would open the way toward 1.34 (H1 EMA200 and daily BB mid). The structural bearish scenario would instead be triggered by a weekly close below 1.34, which would call the entire rebound into question.
How to interpret the current situation
CAKE is in a delicate technical window: the recovery exists, it is real, but it is not yet solid enough to justify aggressive exposure. The conflict between a daily chart that is still neutral and a short term that is already hot — M15 RSI at 70, compressed bands — is exactly the kind of setup where false breakouts are frequent. Short-term traders must keep an eye on 1.44-1.45 as the key level: a rejection in that area, especially in a market still dominated by fear, would be a clear signal to lighten up or stay flat. Those with a longer horizon, instead, can wait for the daily chart to consolidate above the EMAs before building a position with greater conviction.
FAQ
Is CAKE in a structurally bullish trend?
No. Despite the recent recovery, the daily regime is still classified as neutral. The EMA200 at 1.65 dollars remains about 15% away and casts a long shadow over the structural picture. The daily RSI at 56.91 confirms positive momentum, but not enough to speak of a trend reversal.
What are the key levels to watch in the short term?
The immediate resistance is at 1.44-1.45 dollars (hourly and daily R1). A close above this level with strong volume would open room toward 1.51. On the downside, the critical support is at 1.40, where daily S1 and the EMA50 converge. Below 1.34 a structural bearish scenario would be triggered.
What does the compression of the Bollinger Bands on CAKE mean?
The compressed bands on the hourly and 15-minute timeframes indicate very low volatility, with ATR14 at 0.01. This setup often precedes a significant directional move, but does not anticipate the direction. In a context of Fear & Greed at 23, caution is needed before taking a position.
{“@context”:”https://schema.org”,”@type”:”FAQPage”,”mainEntity”:[{“@type”:”Question”,”name”:”Is CAKE in a structurally bullish trend?”,”acceptedAnswer”:{“@type”:”Answer”,”text”:”No. Despite the recent recovery, the daily regime is still classified as neutral. The EMA200 at 1.65 dollars remains about 15% away and casts a long shadow over the structural picture. The daily RSI at 56.91 confirms positive momentum, but not enough to speak of a trend reversal.”}},{“@type”:”Question”,”name”:”What are the key levels to watch in the short term?”,”acceptedAnswer”:{“@type”:”Answer”,”text”:”The immediate resistance is at 1.44-1.45 dollars (hourly and daily R1). A close above this level with strong volume would open room toward 1.51. On the downside, the critical support is at 1.40, where daily S1 and the EMA50 converge. Below 1.34 a structural bearish scenario would be triggered.”}},{“@type”:”Question”,”name”:”What does the compression of the Bollinger Bands on CAKE mean?”,”acceptedAnswer”:{“@type”:”Answer”,”text”:”The compressed bands on the hourly and 15-minute timeframes indicate very low volatility, with ATR14 at 0.01. This setup often precedes a significant directional move, but does not anticipate the direction. In a context of Fear & Greed at 23, caution is needed before taking a position.”}}]}
Disclaimer: This article is for informational purposes only and does not constitute financial advice, investment recommendation or a solicitation to buy or sell financial instruments or cryptocurrencies. The analyses do not guarantee future results. Investments in crypto-assets and financial markets involve a high risk of capital loss. Always do your own research (DYOR) and consult a qualified financial advisor before making any decision.
Content created with the assistance of artificial intelligence and with human editorial review.