

IREN stock sits at a critical crossroads. A transformative AI pivot has driven extraordinary returns, yet the technical picture at $54.72 shows near-term pressure. The long-term structure holds, but the charts demand confirmation before the next leg higher.
Summary
Key takeaways
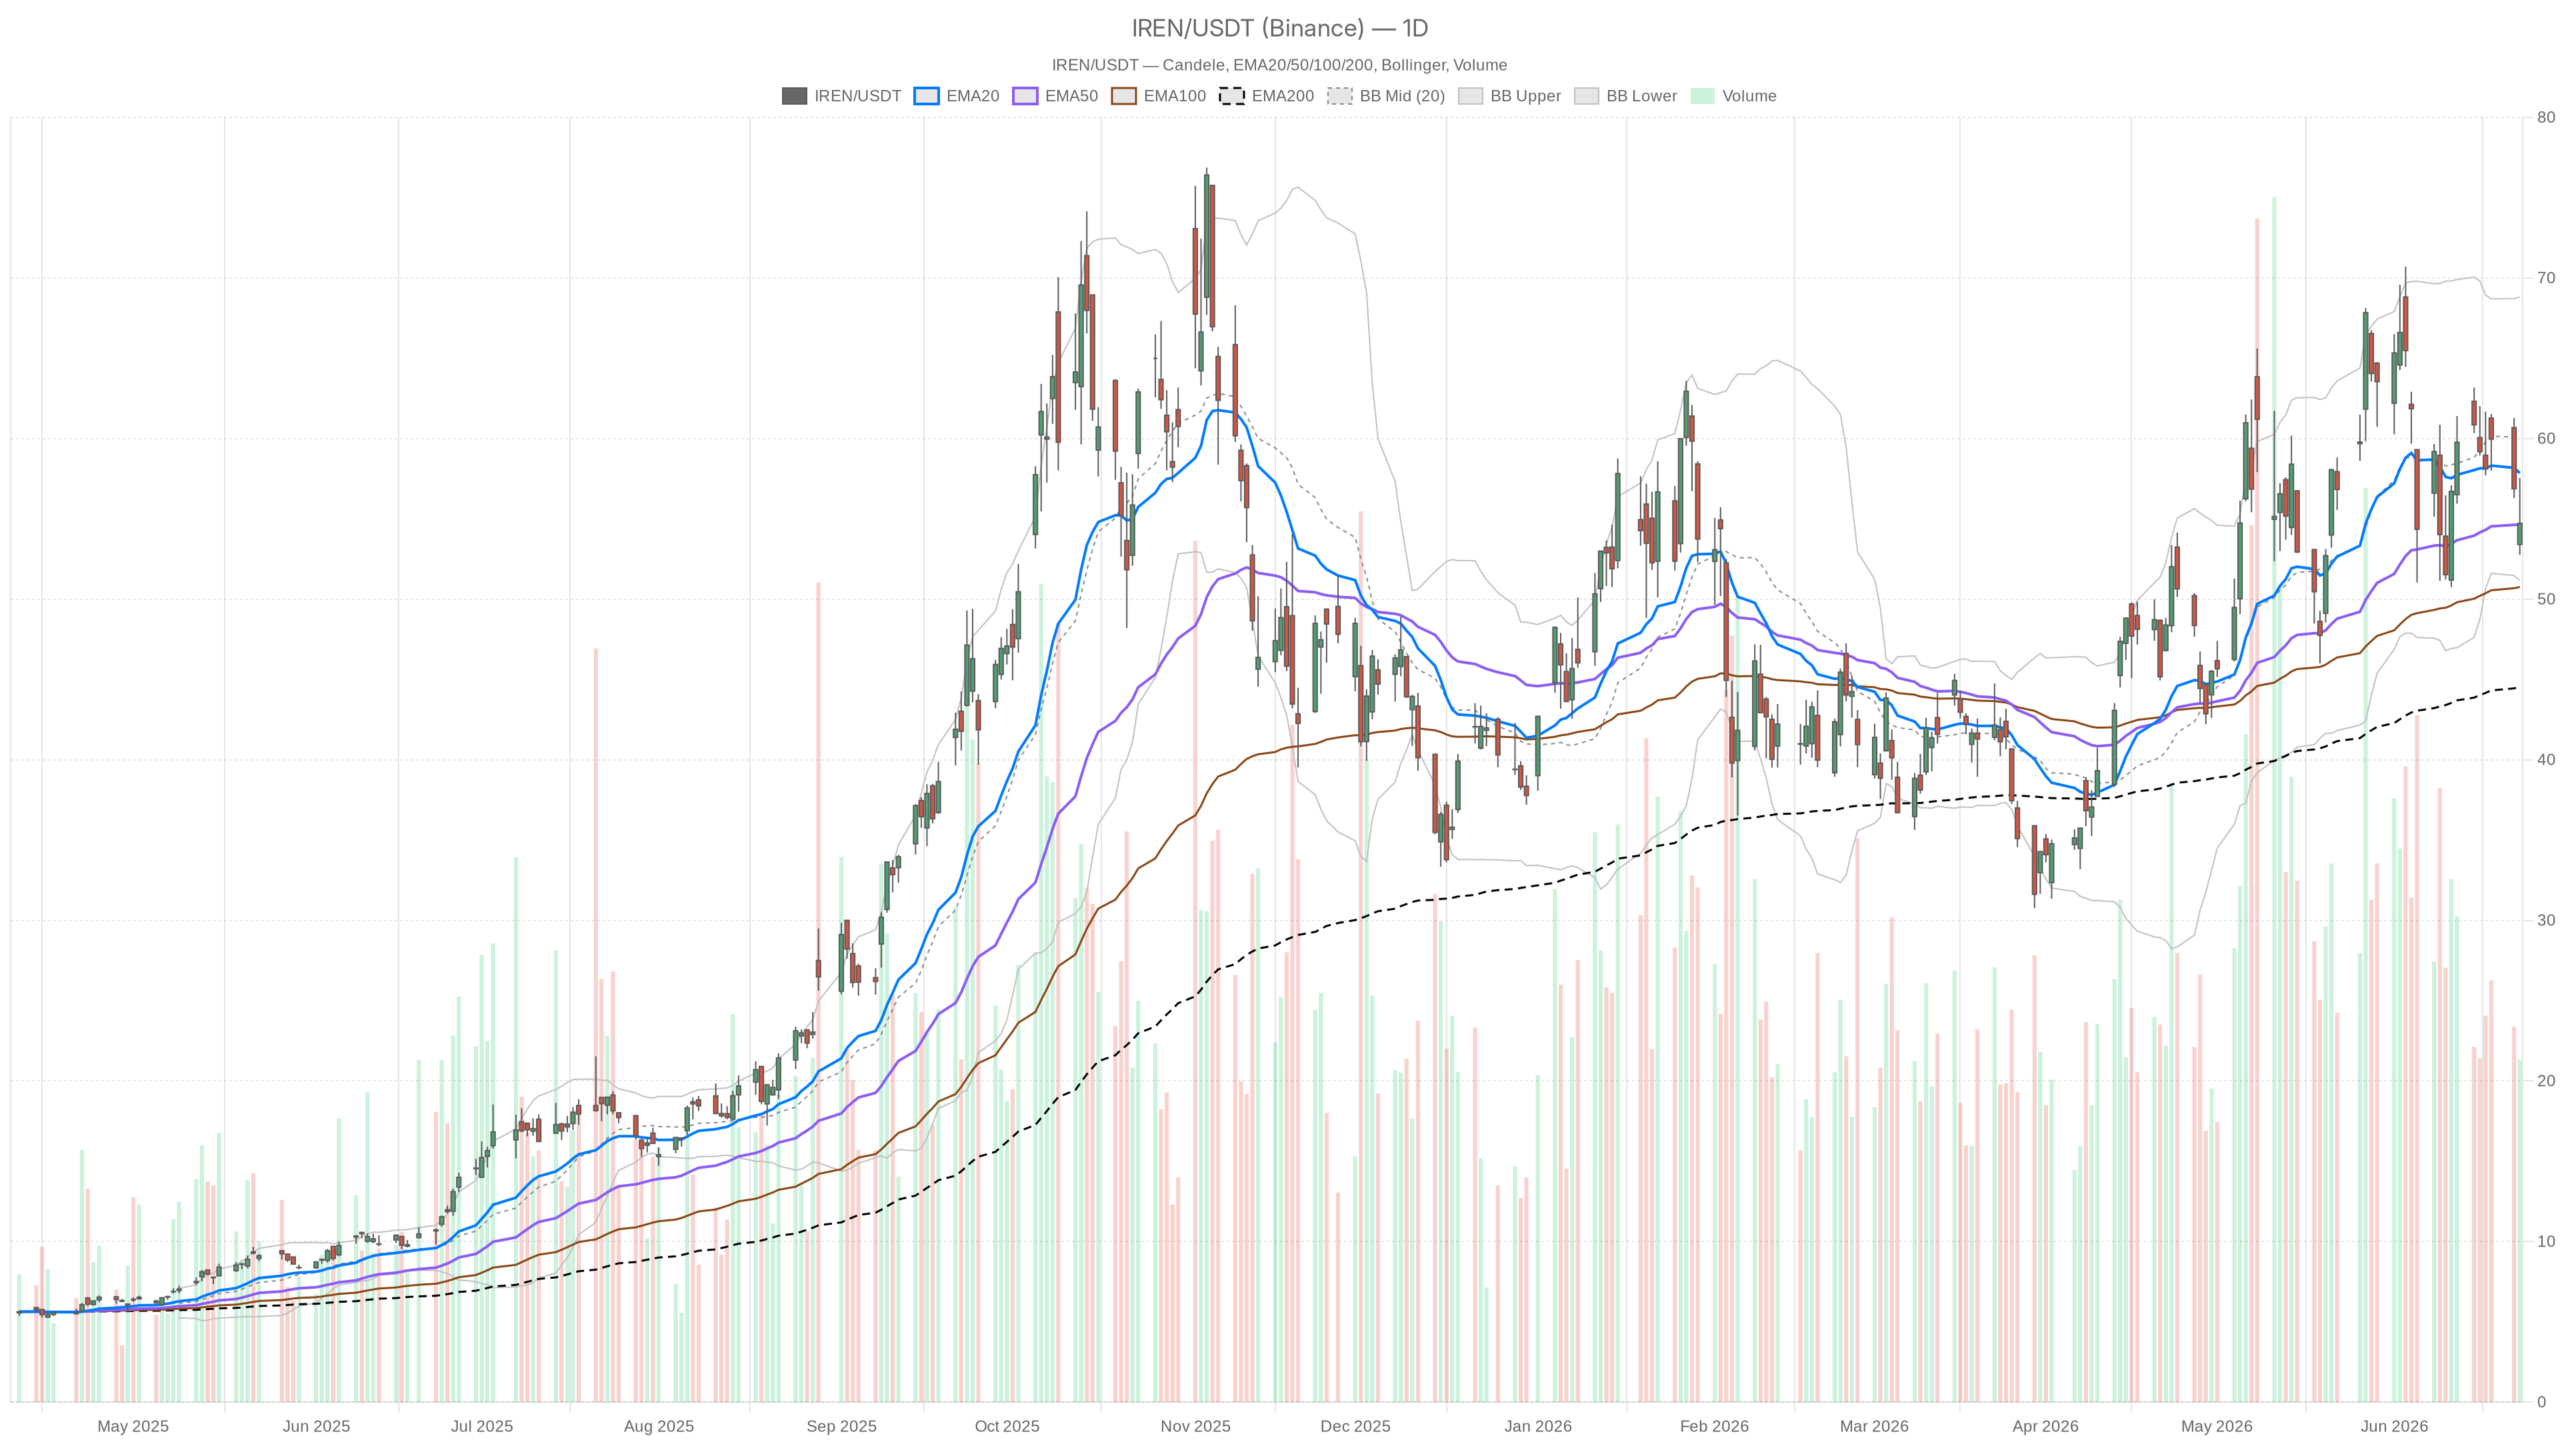
- IREN stock closed at $54.72 on June 23, below the daily EMA20 of $57.85 and testing the EMA50 at $54.63.
- Daily RSI at 46.7 reflects a neutral reset, while the declining MACD histogram warns of fading upside momentum.
- The hourly EMA stack is fully bearish, with all short-term moving averages above price acting as resistance.
- Jefferies maintains a price target implying over 30% upside, backed by a $3.4 billion NVIDIA deal and accelerating AI revenue.
- A daily close above $57.85 would signal the pullback has ended; failure below $52.47 would mark technical deterioration.
Daily Timeframe Preserves IREN Stock’s Uptrend, But Momentum Fades
The daily chart confirms IREN stock’s structural uptrend remains intact, though momentum indicators are flashing caution. Price closed below the EMA20 at $57.85 — the most immediate sign of short-term weakness. The EMA50 at $54.63 sits precisely where price is trading. That makes this a critical decision zone.
Meanwhile, the EMA200 at $44.54 remains well below current price. The broader long-term trend is structurally intact. The stock is consolidating after a significant run — it is not broken. However, the short-term picture requires close attention.
Daily RSI at 46.7 reinforces a neutral read. The market has unwound overbought conditions without collapsing into oversold territory. That represents a healthy reset, though it offers no directional edge on its own. The daily MACD, however, tells a sharper story. The histogram prints at -0.77. The MACD line at 0.59 is falling below its signal at 1.36. Momentum is clearly decelerating.
Notably, the divergence between still-positive MACD values and a turning histogram warns of fading upside energy. It is not a reversal signal, but a clear loss of momentum. Bollinger Bands add further context. The midline sits at $59.99, far above current price. The lower band is at $51.16. IREN closed in the lower half of the band.
This positioning suggests the stock has drifted from its mean and is approaching a potential support zone. Still, significant space remains before any mean-reversion target comes into play. Daily ATR of $5.62 underlines how volatile this name remains. A single session can cover the entire range between S1 at $52.47 and R1 at $57.25.
Hourly Chart Signals Decisive Short-Term Bearish Pressure
The hourly timeframe is decisively bearish for IREN stock, with a fully stacked EMA resistance structure and no near-term reversal signal in sight. The H1 EMA20 at $56.97, EMA50 at $58.00, and EMA200 at $57.49 all sit above price. Every short-term moving average is acting as resistance. This alignment leaves no ambiguity about the near-term direction.
H1 RSI at 35.36 is approaching oversold territory. It is not quite there, but close enough that a short-term bounce cannot be ruled out. However, the H1 MACD is clearly bearish. The MACD line at -1.13 runs below the signal at -0.85. The histogram at -0.28 shows the bearish leg remains active and expanding. The hourly trend confirms and amplifies the daily weakness.
15-Minute Chart: Momentum Exhaustion Within a Bearish Regime
The 15-minute timeframe registers a bearish regime — the only one explicitly labeled as such — though fading MACD momentum hints at a potential micro-pause. Price is below the 15m EMA20, EMA50, and EMA200. These sit at $55.31, $56.39, and $57.70 respectively. The 15m RSI at 40.18 is not yet oversold, leaving room for further short-term pressure.
In contrast, the MACD on this frame is essentially flat. The MACD line is at -0.54, the signal at -0.53, and the histogram at -0.01. This suggests the immediate selling impulse is losing steam. For traders focused on execution, this near-equilibrium hints at a brief consolidation. It does not yet signal a reversal.
Timeframe Conflict Defines IREN Stock’s Near-Term Risk
The conflict between a neutral daily chart and bearish lower timeframes means IREN stock’s path of least resistance remains lower — unless price reclaims $57.85. The daily chart is neutral, neither broken nor bullish. A still-rising EMA200 and a viable EMA50 defense support it. The hourly, however, is clearly bearish with no meaningful support from moving averages.
At the same time, the 15-minute is also bearish but shows signs of momentum exhaustion. In aggregate, the short-term bias tilts lower. The burden of proof sits squarely with the bulls. A decisive reclaim of the daily EMA20 would be required to shift this dynamic.
Fundamental Catalysts Provide a Floor Beneath IREN Stock
IREN stock’s fundamental backdrop complicates a purely bearish technical read, with transformative AI catalysts creating a meaningful valuation floor. Jefferies has backed IREN with a price target implying over 30% upside from current levels. A $3.4 billion NVIDIA deal and rapid AI revenue growth are transformative catalysts.
Furthermore, the 500MW European foothold through the Nostrum Group acquisition in Spain strengthens the case. These are not speculative narratives. They represent contracted capacity and real infrastructure expansion. Seeking Alpha analysts have flagged that the stock’s valuation still has not fully caught up with the pivot.
Therefore, institutional and editorial conviction provides a meaningful fundamental floor. It persists even as technicals remain soft. The long-term strategic repositioning is real and accelerating. However, fundamentals alone cannot dictate near-term price direction.
IREN Stock Scenarios: Bullish Recovery vs. Bearish Breakdown
IREN stock’s near-term direction hinges on whether the EMA50 support at $54.63 holds, separating a bullish recovery from a bearish breakdown. Both scenarios are viable, and the next few sessions should provide clarity.
Bullish Scenario — Reclaiming the $57 Level
The bullish case centers on a hold and recovery from the EMA50 support around $54.63. If price stabilizes here and reclaims ground above $57.25, momentum could shift quickly. That level marks the R1 pivot and the convergence of the EMA20 with H1 resistance. A confirmed break above $57.85 on the daily would signal the pullback has ended. In that context, the Bollinger midline near $60 becomes the first meaningful target. The broader institutional thesis points to significantly higher levels over a longer horizon.
Bearish Scenario — Losing the $54 Floor
On the other hand, the bearish scenario gains credibility if the daily EMA50 fails to hold. A close below $52.47 — the daily S1 pivot — would mark technical deterioration. The fundamental story cannot immediately offset such a breakdown. The Bollinger lower band at $51.16 becomes the next logical destination. Given the ATR of $5.62, that move could unfold in a single volatile session. The bearish H1 EMA stack supports this thesis in the near term.
IREN Stock Verdict: Patience Is the Prudent Strategy
IREN stock presents a classic tension between a strong strategic narrative and a fragile near-term chart. Patience around the $54–$55 zone is the most prudent approach. The long-term structure remains bullish — the EMA200 at $44.54 is far below price and trending upward. The company’s fundamental repositioning is real and accelerating.
Overall, the fundamental thesis for IREN stock is intact. The charts, however, have not yet confirmed what the fundamentals argue. Traders may be better served waiting for price to validate the narrative. A decisive move above $57.85 remains the key trigger for renewed bullish conviction.
FAQ
Is IREN stock a buy right now?
The daily chart is neutral with a bearish tilt on lower timeframes. Price sits at the EMA50 support of $54.63. A confirmed break above $57.85 would be a bullish trigger. Until then, patience is warranted given the bearish H1 EMA stack and fading daily momentum.
What are the key support levels for IREN stock?
The most immediate support is the daily EMA50 at $54.63. Below that, the S1 pivot at $52.47 and the Bollinger lower band at $51.16 are the next levels to watch. The EMA200 at $44.54 provides long-term structural support far below current price.
What is the fundamental case for IREN stock?
IREN is pivoting from Bitcoin mining to AI cloud computing with contracted AI revenue. Key catalysts include a $3.4 billion NVIDIA deal and a 500MW European foothold via the Nostrum Group acquisition. Jefferies maintains a price target implying over 30% upside from current levels.
What would turn IREN stock bullish again?
A decisive daily close above the EMA20 at $57.85 would signal the pullback has ended and bulls are back in control. Reclaiming the R1 pivot at $57.25 would also shift short-term momentum. The Bollinger midline near $60 then becomes the first upside target.
Disclaimer: This article is for informational purposes only and does not constitute financial advice, an investment recommendation, or a solicitation to buy or sell any financial instrument or cryptocurrency. The analysis provided is not indicative of future results. Investing in crypto assets and financial markets carries a high risk of capital loss. Always do your own research (DYOR) and consult a qualified financial advisor before making any decision.
Article produced with the assistance of artificial intelligence and reviewed by the editorial team.