

Nike stock remains under heavy technical pressure despite a Q4 revenue beat. A 12% China sales decline and management uncertainty overshadowed the headline number. The daily chart is unequivocally bearish, with NKE trading well below all key moving averages.
Summary
Key takeaways
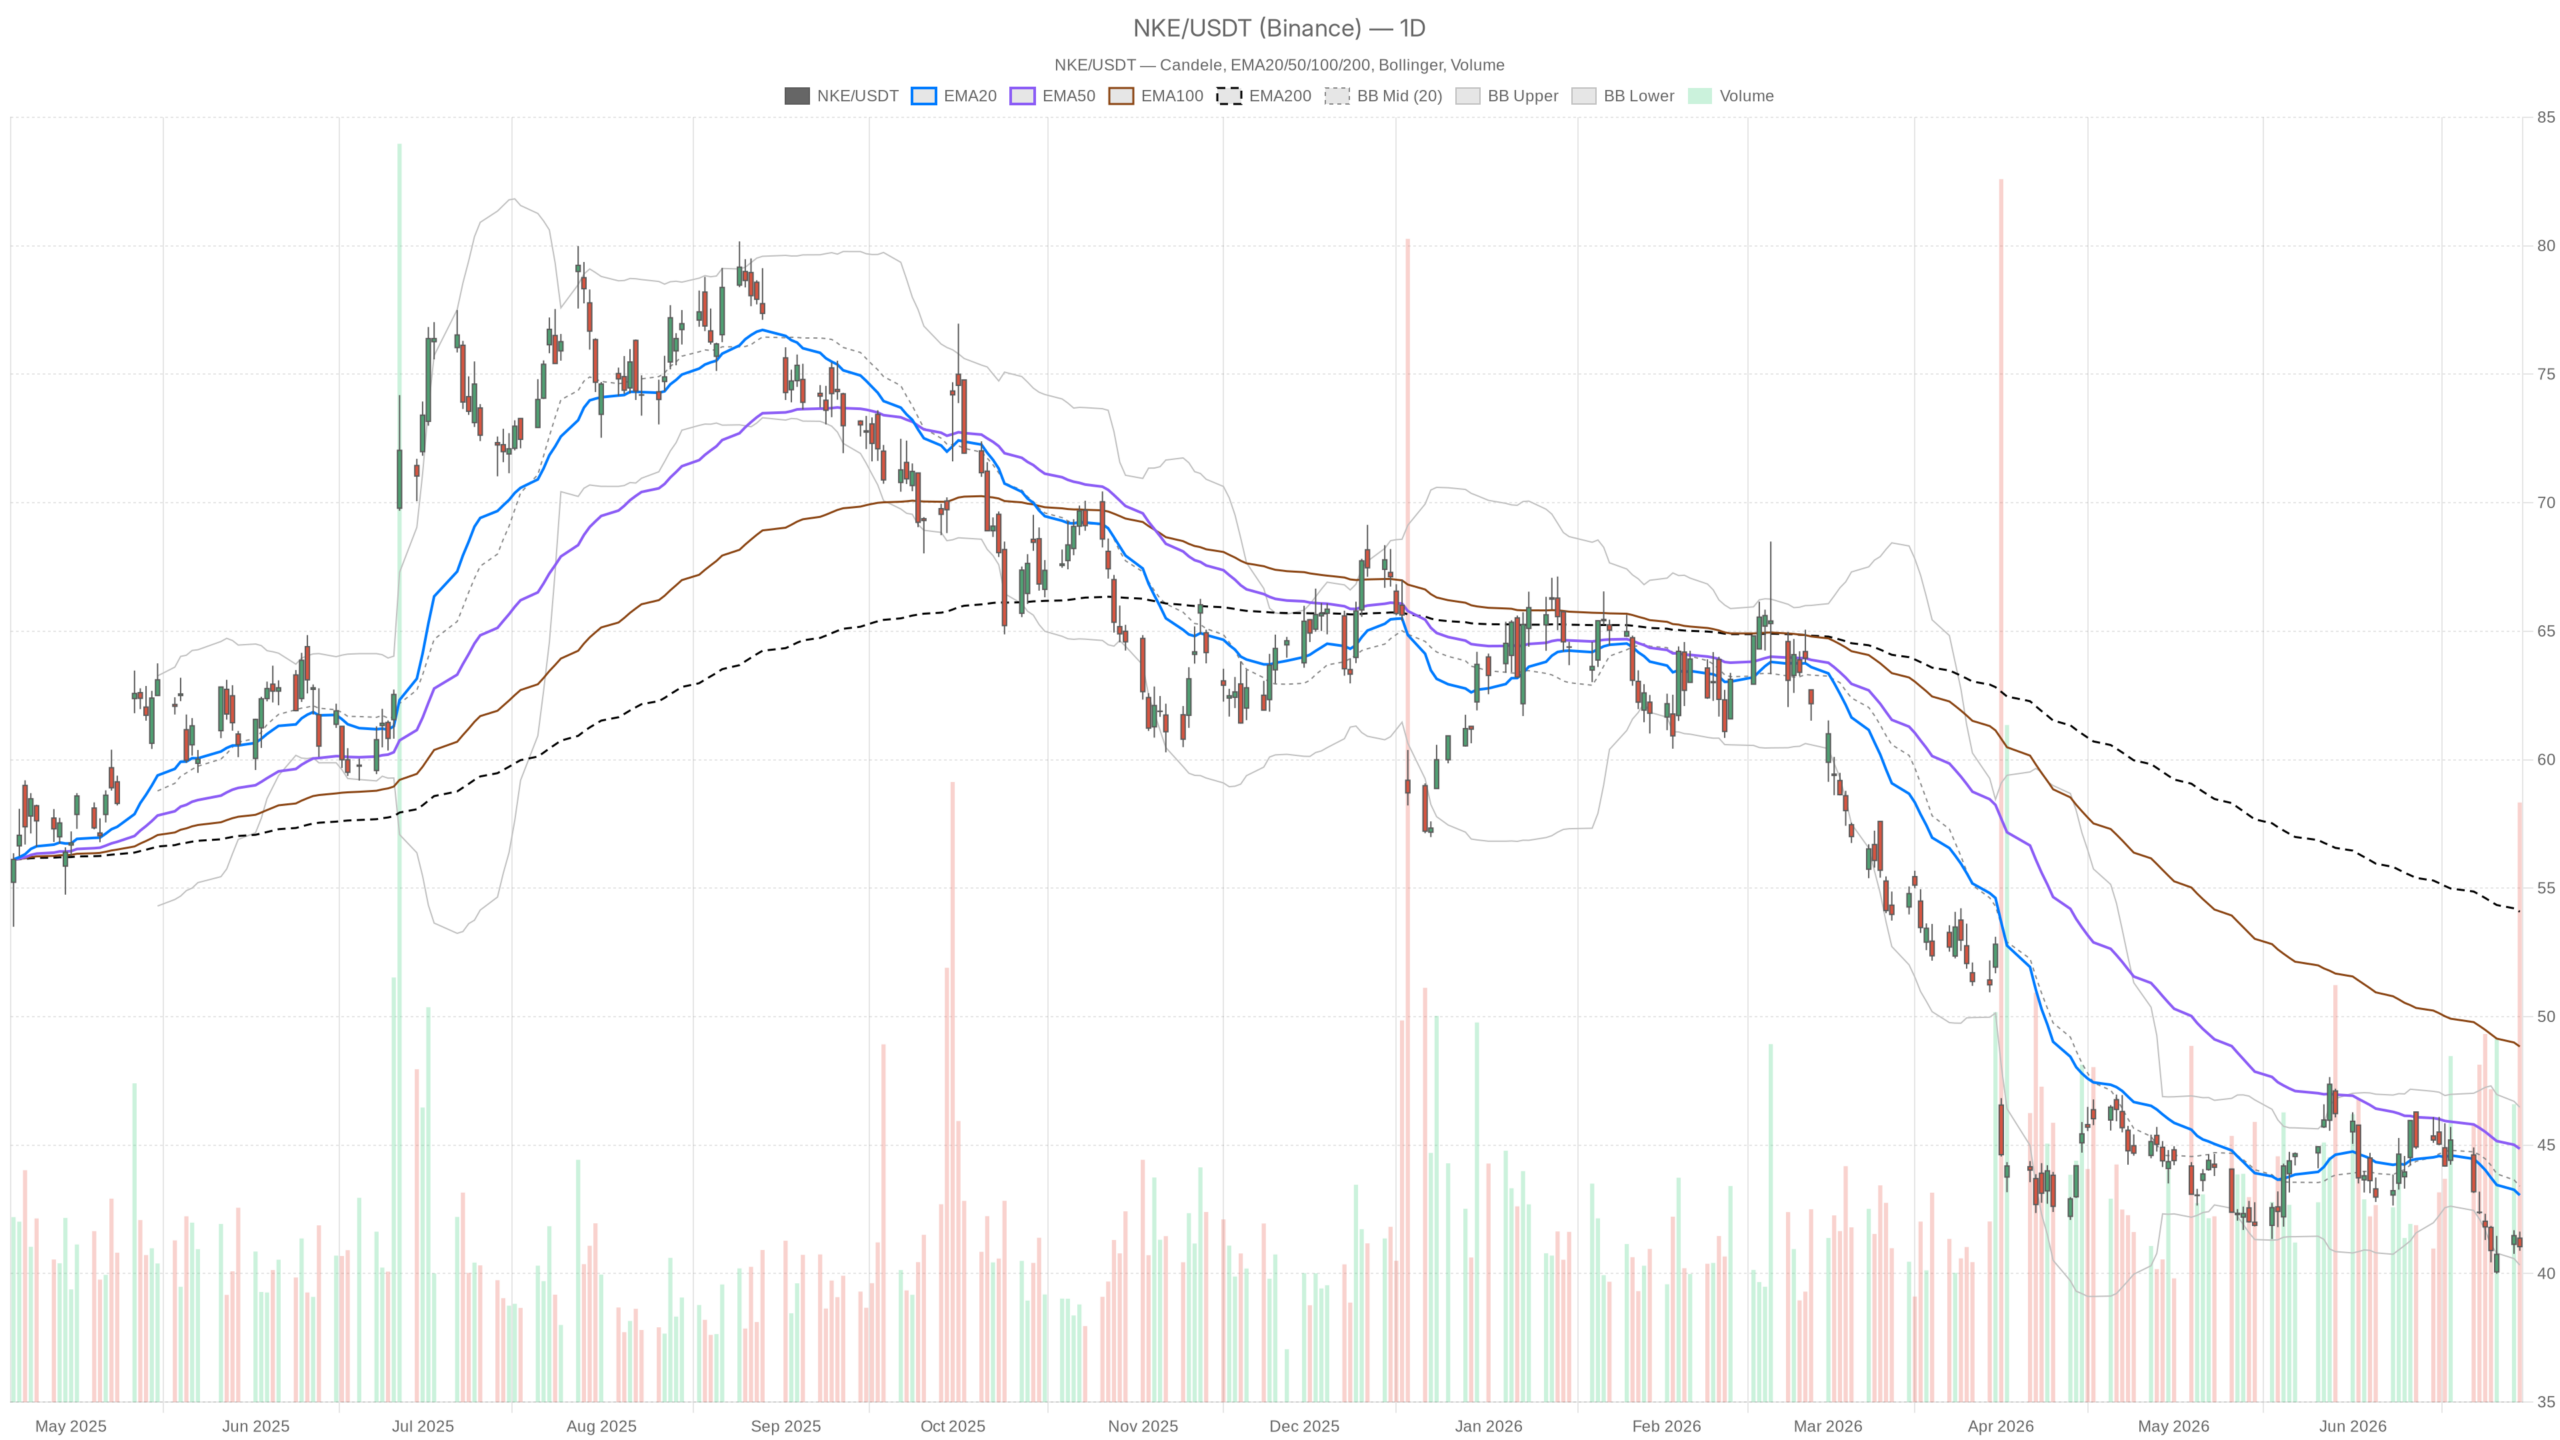
- Nike stock closed at $41.05 on June 30, sitting below the EMA20 ($43.05), EMA50 ($44.86), and EMA200 ($54.09).
- The daily RSI at 37.9 approaches oversold territory but offers no buy signal in a sustained downtrend.
- MACD histogram is widening negatively at -0.36, signaling accelerating downside momentum.
- A break below S1 support at $40.75 could accelerate selling toward the lower Bollinger Band at $40.33.
- NKE pays a 4.02% dividend yield, but no near-term catalysts support a trend reversal.
Daily Trend Reinforces Bearish Control on Nike Stock
The daily regime is explicitly bearish for Nike stock. NKE closed at $41.05 on June 30. It sits well below all three key exponential moving averages. The EMA20 stands at $43.05, the EMA50 at $44.86, and the EMA200 at $54.09. That cascade of declining EMAs reflects sustained selling pressure across multiple time horizons. Price has not threatened any of these levels in a meaningful way. The gap to the 200-day EMA alone exceeds 30%. Recovery from that kind of structural damage requires time and catalysts. Neither appears imminent.
Momentum Indicators Deepen the Bearish Case
Meanwhile, momentum reinforces the bearish thesis. The daily RSI sits at 37.9, approaching oversold territory but not yet there. A low RSI in a downtrend is not automatically a buy signal. It can remain suppressed for extended periods. The MACD is negative across both the line (-0.90) and signal (-0.54). The histogram is widening at -0.36. That divergence signals accelerating downside momentum, not stabilization.
Bollinger Bands and Pivot Structure
Bollinger Band positioning adds further weight to the bearish case. The daily midband is at $43.40. NKE trades comfortably below it at $41.05. The lower band sits at $40.33, leaving limited downside buffer. The ATR of $1.35 reflects moderate daily volatility. It is enough for sharp intraday swings but not a volatility expansion signaling reversal.
On the daily pivot structure, NKE closed just below the pivot point of $41.19. The nearest resistance is R1 at $41.49. S1 support sits at $40.75. The stock remains sandwiched in a tight zone with the technical lean pointing lower.
Short-Term Timeframes Confirm Bearish Bias for Nike Stock
Dropping to the 1H timeframe, the picture largely confirms the daily bearish bias. The hourly close was $41.03. The EMA20 at $41.34 and EMA50 at $41.99 both act as overhead resistance. Price trades below these short-term averages, consistent with intraday sellers maintaining control. The hourly EMA200 at $43.42 remains a distant ceiling. However, one mildly constructive data point exists. The hourly MACD histogram has turned fractionally positive at +0.06. This is a minor short-term divergence from the broader trend. It simply suggests reduced selling pressure, not a genuine reversal.
Meanwhile, the hourly RSI at 40.9 mirrors the daily reading. It is weak, not oversold, and offers no meaningful buy signal. Hourly Bollinger Bands show NKE trading near the lower half of the range. The midband at $41.22 and upper band at $41.70 both act as resistance. The hourly ATR of $0.41 suggests narrow intraday ranges. This is consistent with exhausted price action rather than accumulation.
15-Minute View: Neutral but Not Contrarian
At the 15-minute level, the regime reads neutral. This is a slight deviation from the broader bearish tone. The 15m MACD histogram is slightly negative at -0.04 after briefly turning positive. RSI on this timeframe is 39.36, sitting just below the midpoint. This granular view is useful only for timing short-term entries or exits. It does not change the macro narrative. The 15m pivot support at $40.95 and resistance at $41.20 define the immediate battleground.
Bullish Scenario for Nike Stock Remains Narrow
Still, the bullish scenario is narrow but worth defining. Retail traders are aggressively buying what they call a “generational bottom.” NKE does carry a 4.02% annual dividend yield. This provides some fundamental floor for income-oriented investors. A recovery scenario would require reclaiming $41.49 (R1). Then price would need to push back above the $43.05 EMA20 on the daily chart. Earnings beats demonstrating China stabilization or improving brand momentum would need to follow. Without those catalysts, any bounce is likely to be sold into.
Bearish Scenario Holds Stronger Technical Ground
In contrast, the bearish scenario carries far more technical support. A break below daily S1 at $40.75 would likely accelerate selling. The lower Bollinger Band at $40.33 presents the next downside target. The BTIG price target cut adds institutional pressure to an already fragile setup. With the EMA200 at $54.09 and current price near $41, the stock needs more than 30% upside just to return to its long-term trend average. No near-term catalysts support that move.
Overall Outlook for Nike Stock
Overall, Nike stock faces both technical and fundamental headwinds. The daily trend is bearish and the hourly confirms it. Despite the revenue beat, the fundamental picture is complicated by China weakness and management credibility questions. Short-term traders should treat any bounce toward $41.49–$43.05 as potential resistance rather than breakout. Longer-term investors watching for a genuine turnaround need more than one quarterly beat. Until the brand trajectory shifts and the chart structure repairs, NKE remains a cautious hold at best and a high-risk entry at worst.
FAQ
Is Nike stock in a bearish trend?
Yes, Nike stock is in a confirmed bearish trend. NKE trades below all three key daily EMAs (20, 50, and 200), with the gap to the EMA200 exceeding 30%. Daily momentum indicators including MACD and RSI reinforce the downside bias.
What are the key support levels for NKE?
The nearest support levels are S1 at $40.75 and the lower Bollinger Band at $40.33. A decisive break below these levels could accelerate selling pressure and open the door to deeper losses.
Does Nike’s dividend make the stock attractive right now?
NKE offers a 4.02% annual dividend yield, which provides some fundamental floor for income-oriented investors. However, the technical structure remains firmly bearish and no near-term catalysts support a trend reversal. Income alone does not offset the downside risk.
What would signal a bullish reversal in Nike stock?
A sustained reclaim of R1 at $41.49, followed by a push above the EMA20 at $43.05, would be the first technical step. Fundamentally, earnings beats that demonstrate China stabilization and improving brand momentum would need to follow to confirm a genuine turnaround.
Disclaimer: This article is for informational purposes only and does not constitute financial advice, an investment recommendation, or a solicitation to buy or sell any financial instrument or cryptocurrency. The analysis provided is not indicative of future results. Investing in crypto assets and financial markets carries a high risk of capital loss. Always do your own research (DYOR) and consult a qualified financial advisor before making any decision.
Article produced with the assistance of artificial intelligence and reviewed by the editorial team.