

Robinhood Stock (HOOD) surged to a six-month high of $109.53 on July 1, closing at $108.65. A London product event — unveiling an Ethereum Layer-2 network, tokenized equities, and European perpetual futures — powered the move. But overbought signals suggest caution ahead.
Summary
Key takeaways
- HOOD closed at $108.65 after reaching a six-month high of $109.53 on strong volume of nearly 28 million shares.
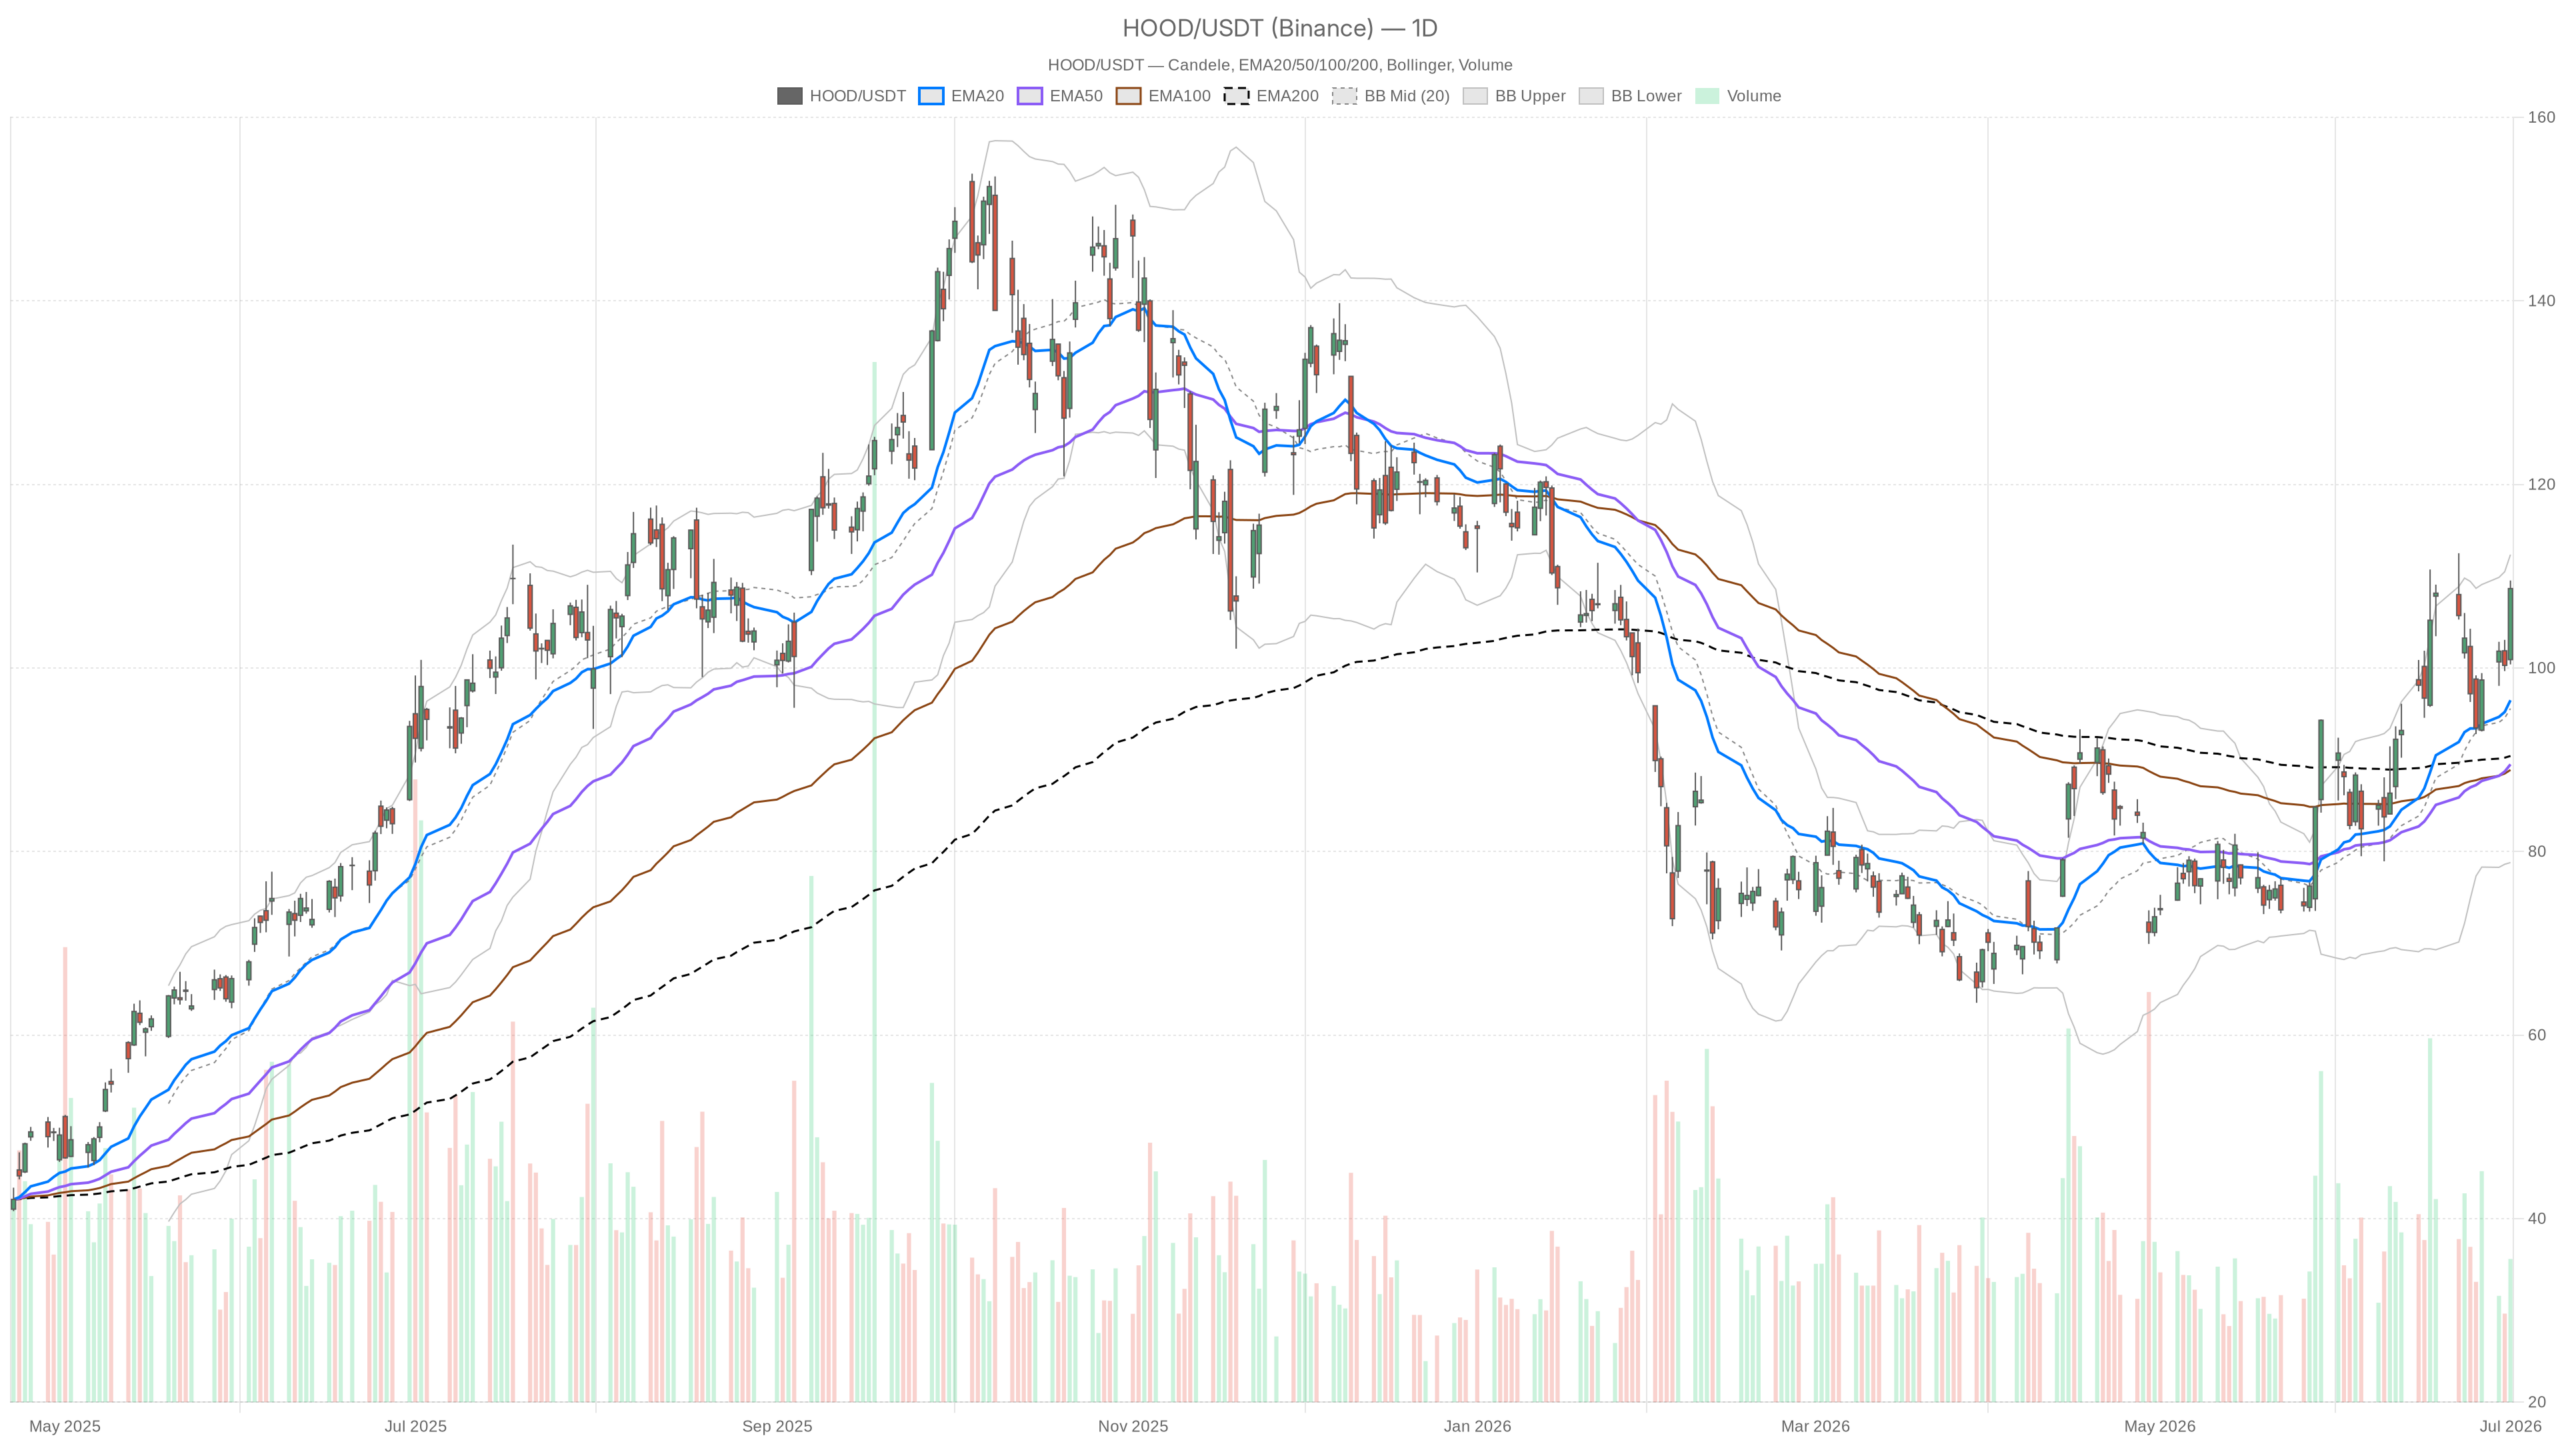
- The daily EMA structure remains bullish, with price well above the EMA20 ($96.49), EMA50 ($89.50), and EMA200 ($90.41).
- Hourly RSI at 69.31 sits just under the overbought threshold, signaling that a consolidation or pullback would be technically healthy.
- The fundamental catalyst — a global expansion strategy including an Arbitrum-powered L2 and tokenized stock trading — is substantive, not incremental.
- Key resistance sits at $111.99 (daily R1), while support at $102.85 (daily S1) is the first line of defense for bulls.
Robinhood Stock Daily Structure Remains Constructive
The daily chart confirms Robinhood Stock is in a structurally constructive uptrend. Price trades well above all three key exponential moving averages. This reflects genuine trend strength rather than a brief technical bounce.
HOOD sits above the EMA20 at $96.49. The EMA50 at $89.50 and EMA200 at $90.41 are clustered below. This stacking alignment confirms bullish momentum. The MACD prints a positive histogram of 0.27. Its line at 5.35 stays above the signal at 5.08. However, the narrow histogram width signals that acceleration is starting to level off.
Momentum Indicators Show Room to Run
At the same time, the daily RSI at 64.36 is elevated but not extreme. Bulls still have room to operate before exhaustion signals emerge. Meanwhile, the Bollinger midband sits at $95.57. The upper band reaches $112.35. HOOD presses into the upper half without tagging the band — leaving technical headroom.
The widening $33.55 band spread reflects breakout-level volatility. The daily ATR of $7.12 reinforces this. On a stock near $108, daily swings of 6–7% are not unusual. Traders must price that into risk assumptions.
Pivot Levels Frame the Near-Term Battlefield
Daily pivot analysis places the pivot point at $106.19. R1 resistance sits at $111.99. S1 support rests at $102.85. HOOD closed above its pivot on strong volume of nearly 28 million shares. The next overhead target is the $111.99 resistance cluster. A break below $102.85 would threaten the bullish structure. Focus would then shift toward the $96–$97 EMA20 zone.
Hourly Chart Confirms Bullish Alignment for HOOD
The hourly chart reinforces the bullish bias with even more explicit momentum. All three EMAs remain in ascending order beneath price. This confirms the daily trend with no structural divergence.
Notably, the hourly EMA20 sits at $104.19. The EMA50 rests at $101.77. The EMA200 is at $93.32. The MACD histogram prints 0.72 — markedly stronger than the daily reading of 0.27. Near-term momentum is actually more aggressive than the broader picture suggests.
Near-Overbought RSI Calls for Caution
Nevertheless, the hourly RSI at 69.31 sits just under the conventional 70 overbought threshold. Buyers have been pushing aggressively. A brief consolidation or shallow pullback would be technically healthy. The hourly Bollinger upper band at $110.30 sits close to current price. HOOD is effectively pressing against the top of its hourly range.
In strong trends, prices can walk the upper band. However, the near-overbought RSI plus band proximity suggests reduced risk-reward for aggressive new longs at current levels.
Short-Term Execution Shows Mixed Signals
The 15-minute chart paints a slightly more cautious picture for immediate execution. Micro-level momentum has softened, though intraday structure remains intact.
Notably, the 15m MACD histogram has turned marginally negative at -0.17. The line at 1.19 slipped just below the signal at 1.36. This is a short-term caution signal — not a reversal, but a loss of micro momentum. The 15m RSI at 64.91 remains constructive. Price holds above the 15m pivot of $108.67.
At the same time, the Bollinger Bands on this timeframe are narrow, reflecting compression after the day’s strong move. This coiling near highs can resolve in either direction. A clean hold above $108.38 — the 15m S1 — would keep intraday structure intact.
Global Expansion Is a Substantive Catalyst for Robinhood Stock
Robinhood Stock’s rally is backed by a credible strategic catalyst, not speculative noise. The London product event packed multiple high-impact announcements into a single session.
Specifically, the company unveiled an AI-native Ethereum L2 blockchain on Arbitrum. It announced tokenized equities, DeFi yield products, perpetual futures in Europe tied to commodities and currencies, and UK cryptocurrency trading. These are not incremental feature updates. They represent a strategic repositioning of Robinhood as a global financial technology platform. Markets rewarded that ambition immediately.
Earnings Concerns Offer a Legitimate Counterpoint
In contrast, TimesSquare Capital Management flagged concerns around weak core earnings in its Q1 2026 investor letter. A significant gap can exist between product announcements and actual monetization timelines. International expansion carries regulatory risk, execution risk, and upfront cost. If future earnings prints disappoint against elevated expectations, the fundamental picture could shift quickly.
Bullish and Bearish Scenarios Define the Path Ahead
The bullish scenario for Robinhood Stock depends on continuation above the $109.53 intraday high. A clean breakout with sustained volume would open a measured move toward daily R1 at $111.99. Beyond that, the upper Bollinger Band at $112.35 becomes the natural ceiling. Continued positive newsflow around the London rollout would reinforce the thesis.
Meanwhile, the bearish invalidation scenario is equally defined. A rejection at current levels followed by a daily close below the $106.19 pivot would signal failing follow-through. A move through $102.85 would threaten bullish structure. Focus would shift toward the $96–$97 EMA20 zone. Given the weak core earnings backdrop, any macro headwind could accelerate such a move.
Overall, Robinhood Stock enters July in a technically strong position. A credible fundamental catalyst and clean trend alignment support the bullish case. The daily regime remains labeled neutral despite price above all major EMAs. This signals the stock is unconfirmed at these elevated levels. Bulls have momentum and narrative. But the stock is stretched and approaching resistance. Positioning carries meaningful volatility risk in both directions. Discipline around entry levels remains the most rational approach.
FAQ
What drove Robinhood Stock to six-month highs?
A sweeping London product event on July 1 served as the catalyst. Robinhood unveiled an Arbitrum-powered Ethereum Layer-2 network, tokenized stock trading, perpetual futures in Europe, and plans for UK cryptocurrency trading. The announcements signal a strategic repositioning toward a global fintech platform.
Is HOOD overbought right now?
The daily RSI at 64.36 remains below overbought territory, giving bulls room to operate. However, the hourly RSI at 69.31 sits just under the 70 threshold. This suggests a brief consolidation or pullback would be technically healthy, though it does not invalidate the uptrend.
What are the key levels to watch on HOOD?
Resistance sits at the intraday high of $109.53, followed by daily R1 at $111.99 and the upper Bollinger Band at $112.35. Support levels include the daily pivot at $106.19, S1 at $102.85, and the EMA20 zone near $96–$97.
What risks could derail the bullish thesis on Robinhood Stock?
Weak core earnings, flagged by TimesSquare Capital Management, represent the primary fundamental risk. International expansion carries regulatory and execution risks with upfront costs. Any macro headwind or risk-off rotation could also accelerate a pullback toward the $96–$97 support zone.
Disclaimer: This article is for informational purposes only and does not constitute financial advice, an investment recommendation, or a solicitation to buy or sell any financial instrument or cryptocurrency. The analysis provided is not indicative of future results. Investing in crypto assets and financial markets carries a high risk of capital loss. Always do your own research (DYOR) and consult a qualified financial advisor before making any decision.
Article produced with the assistance of artificial intelligence and reviewed by the editorial team.