




Delta Air Lines Stock closed at $89.00 on July 9, just above its daily pivot point. The daily trend is unambiguously bullish. Yet intraday hesitation ahead of Friday’s Q2 earnings creates a tense setup that traders cannot ignore.
Summary
Key takeaways
- DAL closed at $89.00, trading above all three major daily EMAs in a stacked bullish alignment
- Daily RSI at 57.83 signals constructive momentum with room to run before overbought territory
- Consensus Q2 estimates point to $18.85 billion in revenue and $1.50 adjusted EPS
- Hourly and 15-minute timeframes show pre-earnings compression, with the 15m Bollinger Bands narrowing sharply
- Daily ATR of $2.94 confirms a $3 normal swing range, keeping both bullish and bearish scenarios within reach
Daily Timeframe: Delta Air Lines Stock Stays in a Strong Uptrend
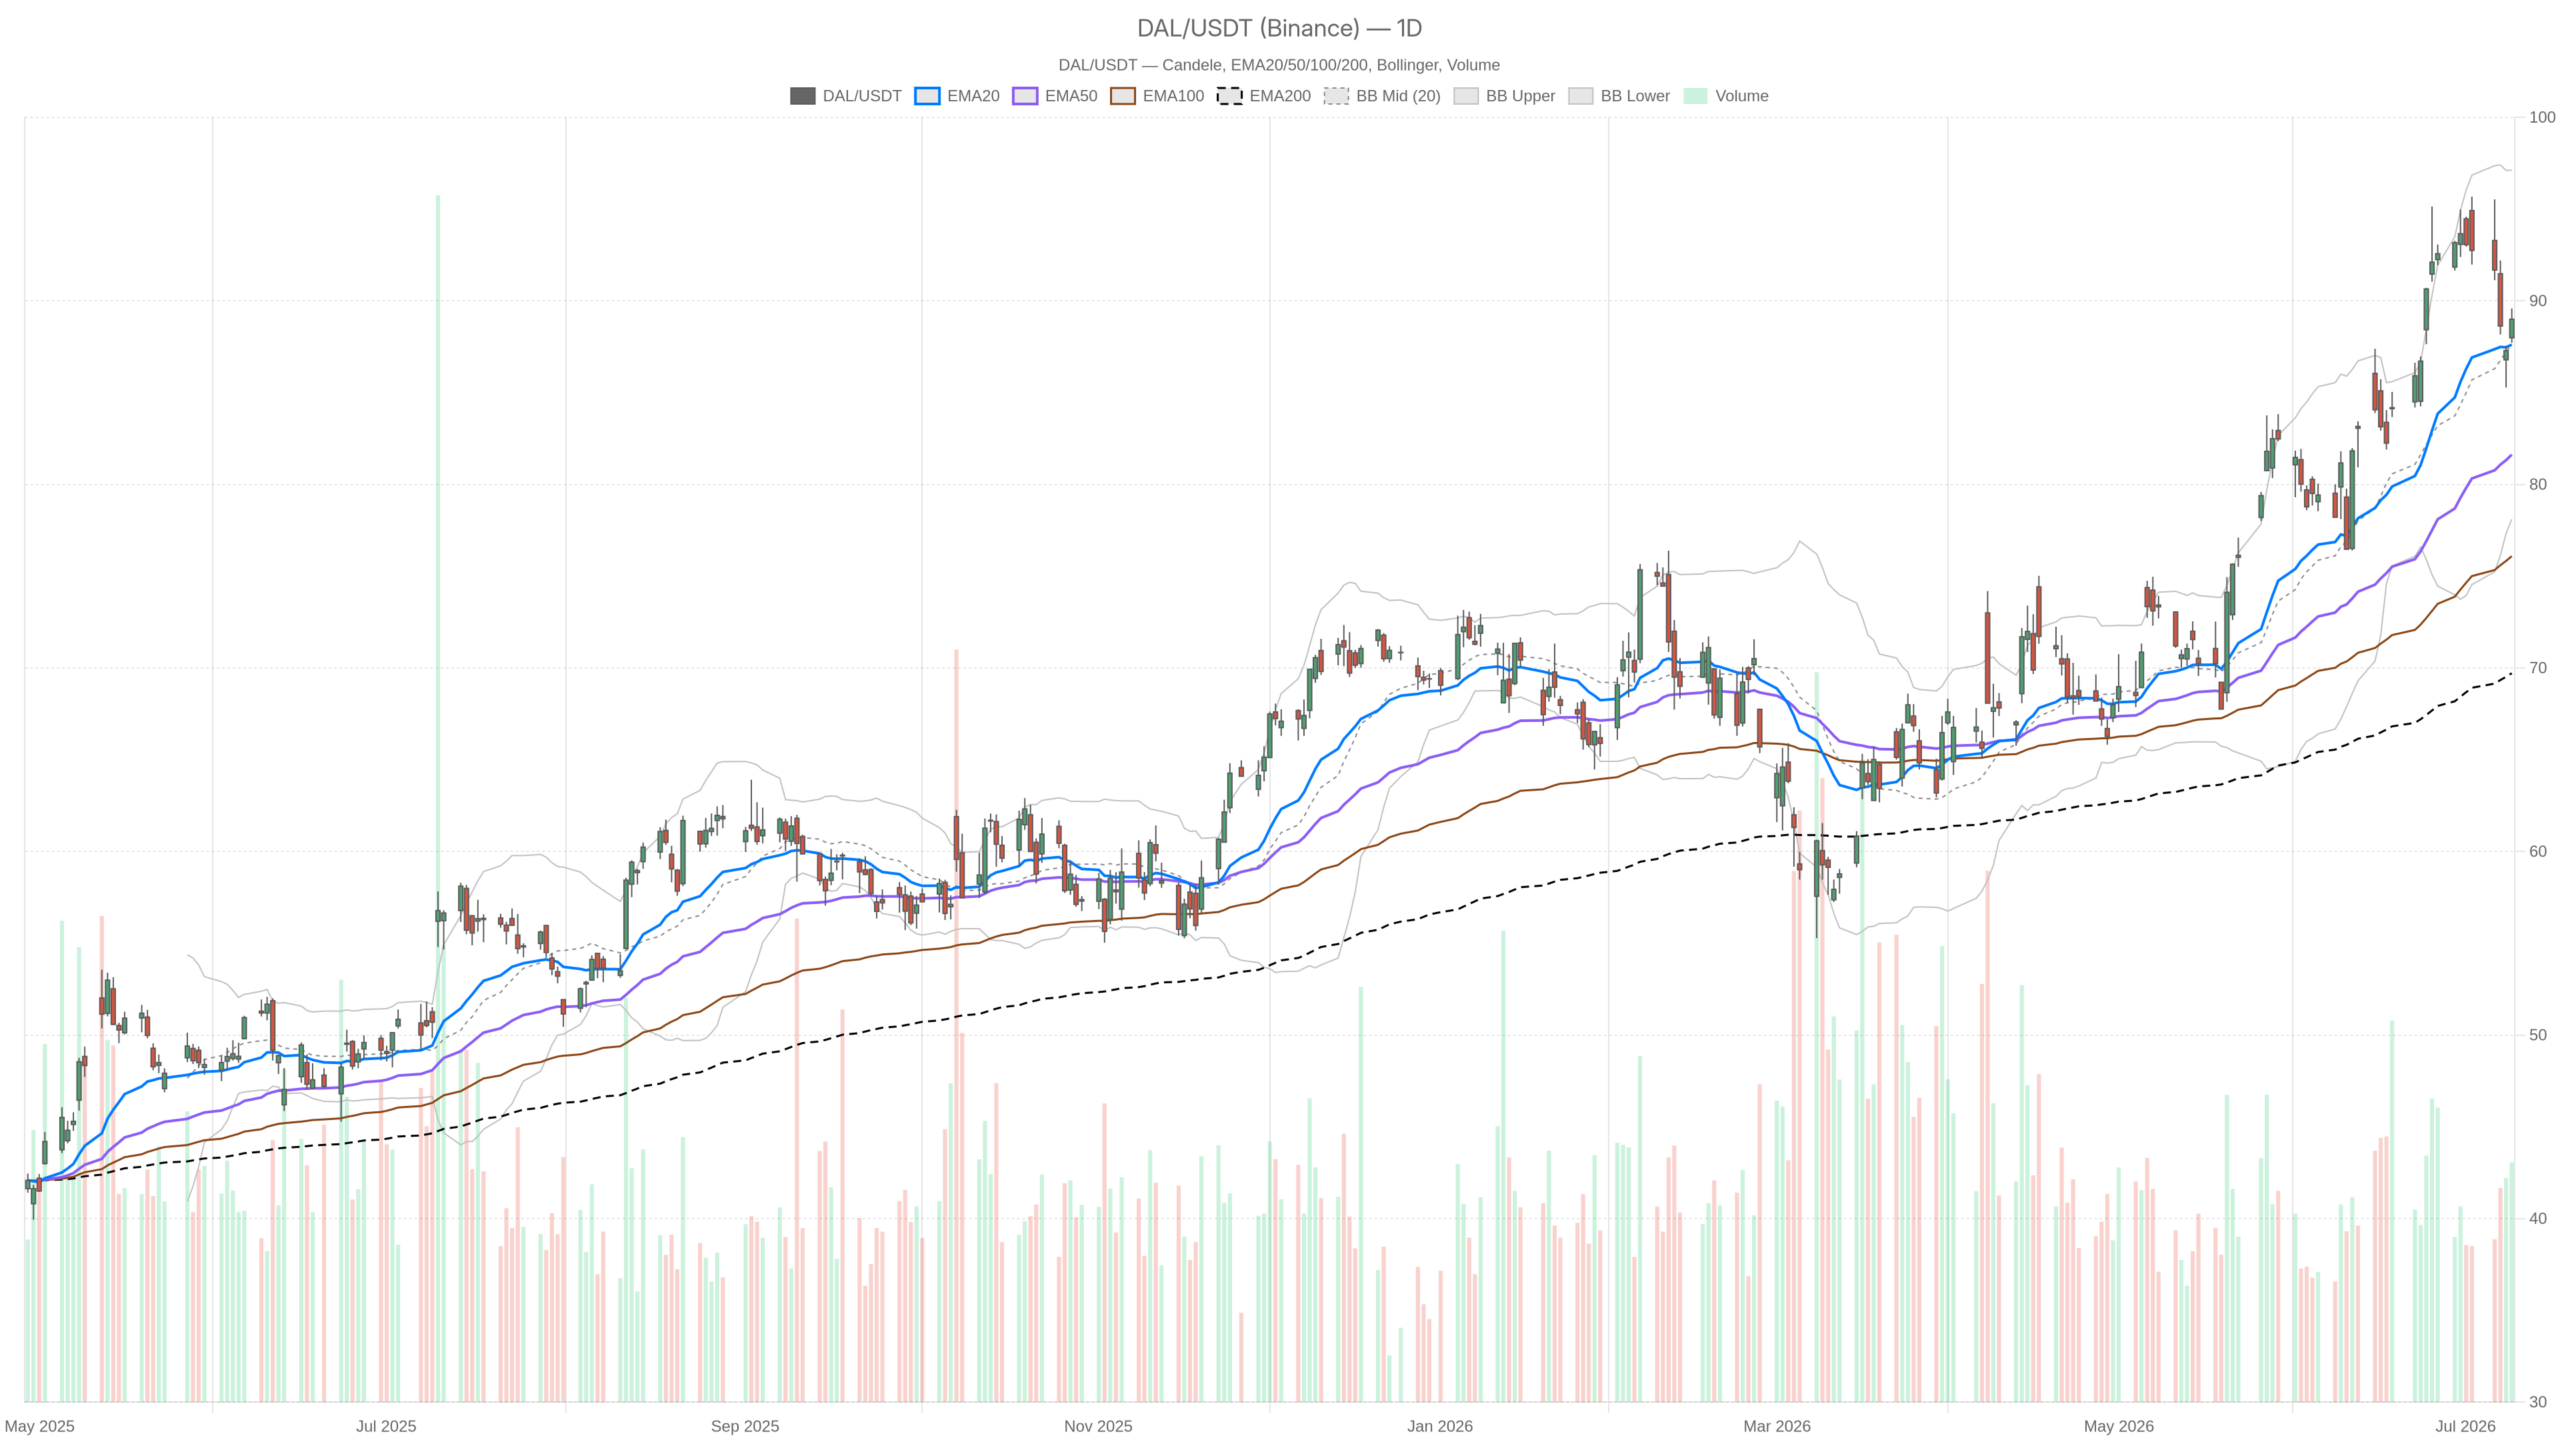
Delta Air Lines Stock remains in a structurally strong uptrend, with price comfortably above all three key daily exponential moving averages. DAL trades at $89.00, well above the EMA20 at $87.62, the EMA50 at $81.62, and the EMA200 at $69.71. This stacked alignment reflects a trend that has built over months — not a recent bounce, but sustained directional momentum.
Meanwhile, the daily RSI at 57.83 places Delta shares in constructive territory. The stock is trending without being overbought, leaving room for further upside before momentum becomes stretched. However, the daily MACD offers a more cautious signal. The MACD line at 3.11 remains positive but has crossed below its signal line at 3.73, producing a histogram of -0.62. Momentum is softening at the margin, though the trend itself remains intact.
Bollinger Bands and Volatility Context
Daily Bollinger Bands show price trading near the midline at $87.61. The upper band sits at $97.12 and the lower band at $78.10. This wide spread reflects elevated daily volatility — consistent with the ATR14 of $2.94. In practical terms, a $3 daily swing range is normal for DAL right now. Options pricing ahead of earnings is likely already reflecting this volatility premium.
Pivot Structure and Key Levels
The daily pivot structure supports a cautiously bullish posture. The pivot point sits at $88.77, with R1 resistance at $89.82 and S1 support at $87.95. DAL closed at $89.00 — effectively pinned between the pivot and R1. A clean break above $89.82 would represent a meaningful short-term breakout. Conversely, a slip back below $87.95 would bring the EMA20 at $87.62 into play as the first real defense.
Hourly Conflict: Intraday Structure Weakens the Bullish Case
The 1-hour chart paints a more conflicted picture than the daily. Price on the hourly timeframe sits above the EMA20 at $88.80 and well above the EMA200 at $85.97. However, it remains below the EMA50 at $89.78. That positioning signals a market recovering intraday but one that has not yet reclaimed full short-term momentum.
The 1H RSI at 48.72 reinforces the neutral outlook — neither oversold nor building upward pressure. In contrast, the 1H MACD offers a more constructive signal. The MACD line at -0.58 is negative, but the histogram has turned to +0.32. That means momentum is actively recovering even as the line stays below zero. This histogram crossover is a genuine short-term positive, though not decisive.
Hourly Bollinger Bands show price at $88.98 trading near the midline at $88.12, with the upper band at $90.47. The 1H ATR of $0.97 confirms a tightening volatility environment at the intraday level — typical pre-earnings compression. The hourly pivot places resistance at $89.25 and support at $88.57. DAL is holding within this compressed range while the market waits for Friday’s catalyst.
The 15-Minute View: Execution Context Into the Print
The 15-minute chart confirms a neutral pre-earnings posture, with price recovering from a recent pullback but lacking conviction. Price sits above the EMA20 at $88.71 and EMA50 at $88.56 — a minor positive. Notably, however, the EMA200 on this timeframe stands at $90.01, above current price. Delta Air Lines Stock is therefore still recovering on a very short-term basis. The 15m RSI at 57.31 suggests mild upward momentum without commitment.
The 15m MACD histogram is slightly negative at -0.08 — a near-zero reading that implies equilibrium rather than directional strength. Bollinger Bands are tightly compressed, with the upper band at $89.28 and the lower at $88.51. This kind of pre-earnings compression typically precedes an explosive move in either direction following the report.
The Earnings Catalyst: What the Market Is Watching
The Q2 earnings report is the dominant catalyst for Delta Air Lines Stock. Analysts track a consensus revenue estimate of $18.85 billion and adjusted EPS of $1.50, according to Koyfin data. The market’s focus extends beyond the headline numbers. Jet fuel costs, premium cabin demand, loyalty revenue growth, and forward guidance on summer travel are all expected to drive the initial reaction.
Analysts have described the pre-print setup as constructive for airlines. That framing aligns with the technical backdrop — Delta Air Lines Stock trades near multi-month highs in a confirmed uptrend, with no obvious technical breakdown suggesting anticipatory selling. Still, earnings reports are binary events. DAL’s tight pre-report compression on the 15-minute chart indicates the market has not yet committed to a directional bet.
Bullish Scenario: Earnings Confirm the Trend
A strong Q2 report would validate the bullish technical structure. If Delta delivers results at or above consensus — particularly on premium demand and forward guidance — the path higher is well-supported. A break above the daily R1 at $89.82 would provide the first confirmation. Beyond that, the upper Bollinger Band on the daily chart at $97.12 defines the broader upside range within the current volatility envelope.
Underlying support for this scenario is solid. The EMA stack on the daily chart is cleanly bullish. RSI has room to run toward overbought territory. Should momentum buyers return after a positive earnings reaction, the path toward $93–$97 becomes plausible within the existing trend channel. The sustained premium above the EMA200 at $69.71 confirms this is not speculative froth — it reflects a genuine repricing of fundamentals.
Bearish Scenario: Disappointment Breaks the Structure
In contrast, a miss on earnings — or weak guidance on fuel costs and summer yields — could trigger a sharp reversal. The first technical support on a selloff sits at the daily S1 of $87.95 and the EMA20 at $87.62. Those levels are only $1.38 below Friday’s close, well within a single session’s ATR of $2.94. That proximity matters: a post-earnings gap down could breach both levels simultaneously.
A sustained close below the EMA20 would shift the daily regime from bullish to neutral. A deeper move toward the EMA50 at $81.62 would represent a 9% drawdown and technically challenge the multi-month uptrend. The key question is not whether DAL is in an uptrend — it clearly is — but whether the earnings catalyst confirms or disrupts it.
Positioning and Volatility: A Catalyst-Driven Market
Overall, Delta Air Lines Stock enters its Q2 earnings report from a position of technical strength. The daily trend is intact, momentum is healthy if not accelerating, and price holds above key structural support. At the same time, the hourly and 15-minute timeframes reflect a market in wait-and-see mode. Intraday momentum is recovering but not yet convincing.
Volatility has compressed pre-report, setting the stage for an outsized move in either direction. For those already positioned long, the setup offers defined risk around the EMA20 and daily S1. For those considering new exposure, the earnings print itself is the decisive input. Technical analysis can frame the range of scenarios, but it cannot predict the catalyst. The trend favors bulls. The uncertainty belongs to Friday morning.
FAQ
What are the key support and resistance levels for Delta Air Lines Stock ahead of Q2 earnings?
Key resistance sits at the daily R1 of $89.82, with the upper Bollinger Band at $97.12 defining the broader upside. Support rests at the daily S1 of $87.95 and the EMA20 at $87.62, with deeper support at the EMA50 of $81.62.
What are the consensus estimates for Delta’s Q2 earnings?
According to Koyfin data, analysts are tracking a consensus revenue estimate of $18.85 billion and adjusted EPS of $1.50. Market attention also extends to jet fuel costs, premium cabin demand, loyalty revenue growth, and summer travel guidance.
What does the daily RSI of 57.83 indicate for DAL?
The daily RSI at 57.83 places Delta Air Lines Stock in constructive territory — trending without being overbought. This leaves room for further upside before momentum becomes stretched, supporting the broader bullish case.
How does the intraday picture differ from the daily trend for DAL?
The daily chart is unambiguously bullish, with price above all major EMAs. However, the hourly chart is classified as neutral, with price below the EMA50 at $89.78 and the 1H RSI at 48.72. The 15-minute chart also shows pre-earnings compression, reflecting market hesitation ahead of the binary catalyst.
Disclaimer: This article is for informational purposes only and does not constitute financial advice, an investment recommendation, or a solicitation to buy or sell any financial instrument or cryptocurrency. The analysis provided is not indicative of future results. Investing in crypto assets and financial markets carries a high risk of capital loss. Always do your own research (DYOR) and consult a qualified financial advisor before making any decision.
Article produced with the assistance of artificial intelligence and reviewed by the editorial team.
