



Summary
SpaceX Stock Under Pressure as Post-IPO Decline Accelerates
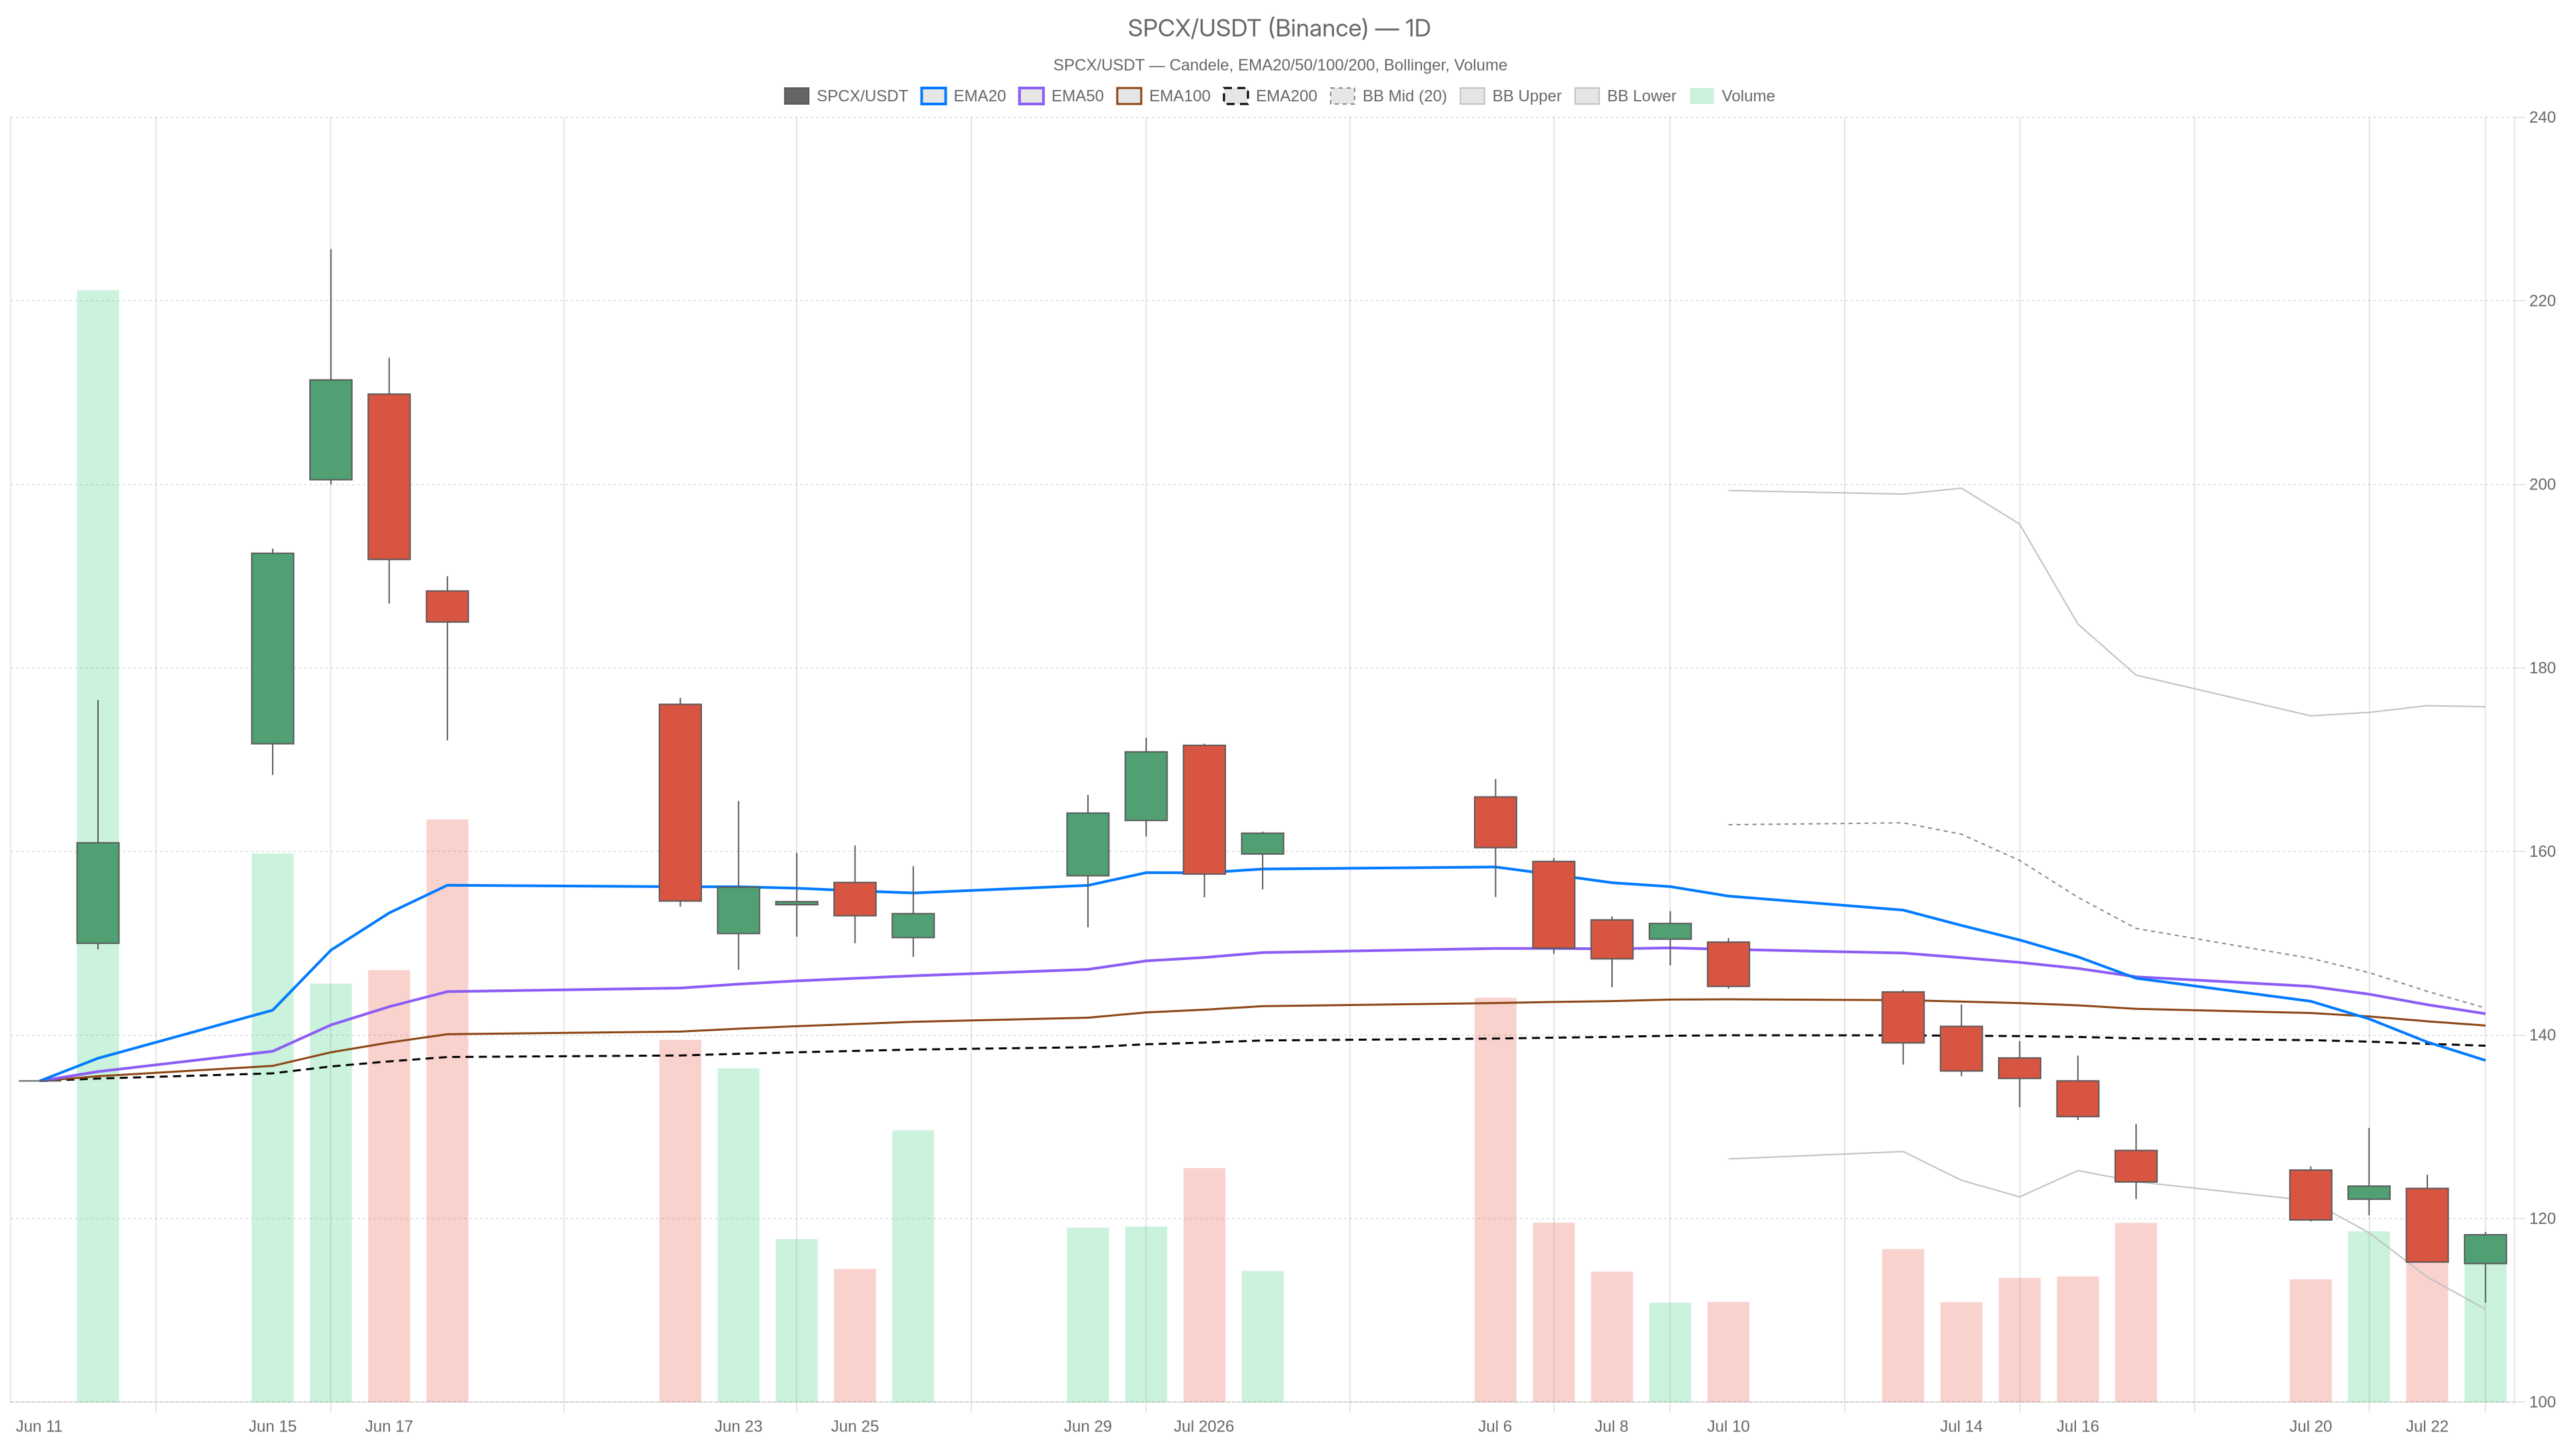
SpaceX (NASDAQ: SPCX) is in a clear downtrend. The daily chart confirms bearish control across every meaningful indicator, and the fundamental backdrop offers little reason to expect a near-term reversal. The stock closed at $118.24 on July 23, well below its $135 IPO price from June. It has shed roughly 27% for the month alone.
Short sellers have reportedly amassed an estimated $15.5 billion in unrealized gains, according to data from Ortex Technologies cited by Reuters. That figure alone signals how decisively market sentiment has shifted since the public debut.
The session on July 23 showed some intraday resilience. The stock moved from an open of $115.10 to close at $118.24. However, that recovery is happening well below every major moving average. The broader structural damage is clear.
Key takeaways
- SpaceX (SPCX) closed at $118.24 on July 23, down roughly 27% for the month and well below its $135 IPO price.
- Short sellers have amassed an estimated $15.5 billion in unrealized gains, according to Ortex Technologies data cited by Reuters.
- The daily EMA20 ($137.24), EMA50 ($142.32), and EMA200 ($138.84) all sit significantly above current price, confirming sustained selling pressure.
- Insider lock-up agreements begin expiring in August, creating a confirmed near-term supply overhang.
- The daily MACD histogram at -3.84 shows bearish momentum is still expanding, not fading.
SPCX Daily Chart: Moving Averages Paint a Damaging Picture
The daily moving average alignment confirms sustained selling pressure. Price at $118.24 trades significantly below the EMA20 at $137.24, the EMA50 at $142.32, and the EMA200 at $138.84. That kind of alignment — price compressed beneath stacked declining averages — reflects persistent distribution, not a temporary dip.
Momentum Indicators Deepen the Bearish Signal
The daily RSI14 reads 42.26. That places SPCX in oversold-adjacent territory without yet triggering a classic reversal signal. Momentum remains soft. Meanwhile, the MACD reinforces the bearish case: the line stands at -9.04, the signal at -5.19, and the histogram at -3.84. The histogram’s depth suggests bearish momentum is still expanding, not fading.
Volatility and Pivot Levels Add Context
Bollinger Bands on the daily frame place the lower band at $110.12, with the midline at $142.95. Price is pressing toward the lower band. In trending markets, price can walk the band lower for extended periods — this does not automatically signal a buy. The ATR14 of 8.43 confirms that daily swings are wide. This is a volatile stock, and the risk of sudden moves in either direction is real.
Pivot analysis adds one note of caution for bears. The pivot point sits at $115.88, with R1 at $120.91 and S1 at $113.21. The close at $118.24 is above the daily PP, which at minimum shows buyers showed up near session lows. However, reclaiming R1 at $120.91 convincingly would be the first meaningful test of whether this bounce has legs.
Hourly View Confirms the Bear Case — With One Small Caveat
The hourly timeframe reinforces the bearish regime. The 1H EMA200 is at $145.42 — far above current price. The EMA50 at $125.66 and EMA20 at $119.20 are both above where SPCX is trading. The stock sits under every significant average on this timeframe as well.
MACD Offers a Flicker of Short-Term Relief
The 1H RSI stands at 43.70, still below the neutral 50 threshold. That confirms momentum has not flipped. On the other hand, the 1H MACD histogram has edged positive at 0.24. The line at -2.97 has crossed slightly above the signal at -3.21. That minor MACD crossover is the one flicker of short-term relief visible in the hourly data. It does not change the trend — but it does suggest the pace of selling may be briefly slowing.
Hourly pivot levels tighten the near-term picture. The PP is at $117.61, with R1 at $119.22 and S1 at $116.68. The close at $118.28 is marginally above the hourly PP, aligning with the small intraday recovery seen during the session. Holding above $116.68 in the next few sessions would be the minimum requirement for bulls to defend any short-term base.
15-Minute Frame: Short-Term Momentum Flickers, Not a Trend Reversal
The 15-minute chart offers the only genuinely positive signal across all three timeframes. The RSI14 on this frame reads 61.09 — above the neutral midpoint and approaching short-term overbought territory. The MACD histogram is at 0.43, with the line crossing positive. Price is also above the 15m EMA20 at $116.25 and EMA50 at $117.69.
In context, this means the immediate intraday move was upward. That is useful for short-term timing. It is not, however, a signal to challenge the daily downtrend. The 15m EMA200 sits at $126.16 — still well above price — and the broader structure remains broken.
Fundamental Headwinds: Lock-Up Expiry and the Merger Wildcard
The fundamental backdrop for SpaceX stock adds material risk. Insider lock-up agreements are set to begin expiring in August. A significant volume of shares could soon become available to the public market. That supply overhang is a credible short-term headwind — particularly for a stock already down sharply from its IPO price.
At the same time, a new derivatives product has entered the picture. YieldMax launched YSPC, described as the first ETF built to generate income from SpaceX stock options. SPCX is already down sharply since going public. With no distribution history established, the product raises more questions than it answers for investors trying to assess fair value.
Notably, Elon Musk came closer than ever to addressing long-running speculation about a potential Tesla-SpaceX combination. He addressed the topic on Tesla’s Q2 earnings call but stopped short of confirming anything. A confirmed merger would represent a structural event capable of repricing SPCX significantly. For now, it remains speculation, and markets are not pricing it as an imminent catalyst.
Bullish Scenario: What Would Need to Change
A credible bullish reversal requires SPCX to reclaim the daily pivot at $115.88 and hold it as support. Beyond that, a sustained push above $120.91 — the daily R1 — would be the first signal of change. It would indicate the post-IPO selloff is losing its grip. If the hourly MACD crossover extends and RSI climbs back through 50 on the 1H, that would provide confirmation. Short-term momentum would have genuinely shifted.
On the fundamental side, any clarity around the Tesla-SpaceX merger narrative could act as a powerful catalyst. Positive developments on Starship or commercial contracts could also reset investor expectations. Those are event-driven scenarios, not structural ones. Still, in a stock already down 27% in a month, sentiment can shift rapidly on news flow.
Bearish Scenario: The Path of Least Resistance Remains Lower
The bears remain firmly in control. The August lock-up expiry represents a near-term supply catalyst that is already confirmed. With $15.5 billion in short-seller profits on the table, any relief rally could attract fresh selling. Below the daily S1 at $113.21, the next meaningful support is the Bollinger lower band at $110.12. A break there would open up a retest of the $110 area. Given the daily ATR of 8.43, such a move could occur within a handful of sessions.
The bearish scenario is invalidated only by a decisive close above the daily EMA20 at $137.24. That level sits more than 16% above current price. Until then, the structure of lower highs and lower lows remains intact on the daily chart.
Positioning and Volatility: A Market That Demands Caution
Overall, SPCX presents a technically damaged chart with bearish momentum across the daily and hourly timeframes. The minor 15-minute recovery is a timing signal at best. The daily regime is classified as neutral rather than outright bearish — a nuance worth noting. However, the indicator stack, moving average alignment, and MACD depth all point in one direction: lower.
The August lock-up expiry adds a concrete supply-side risk that technical charts cannot price in advance. Volatility remains elevated, and the ATR confirms wide daily ranges. Uncertainty around the Tesla merger narrative could trigger sharp moves on either side. This is not a market for complacency. Positioning requires discipline, clear levels, and respect for the broader downtrend until price proves otherwise.
FAQ
What is the current price of SpaceX (SPCX) stock?
SpaceX (SPCX) closed at $118.24 on July 23, 2026. The stock is trading well below its $135 IPO price from June and has declined roughly 27% in a single month.
How much have short sellers made on SPCX stock?
Short sellers have amassed an estimated $15.5 billion in unrealized gains on SPCX, according to data from Ortex Technologies cited by Reuters. This figure reflects how decisively market sentiment has shifted since the public debut.
When does the SpaceX lock-up period expire?
Insider lock-up agreements for SpaceX are set to begin expiring in August 2026. This creates a confirmed near-term supply overhang, as a significant volume of shares could become available to the public market.
What would need to happen for SPCX to turn bullish?
A credible bullish reversal would require SPCX to reclaim the daily pivot at $115.88 and hold it as support. Beyond that, a sustained push above $120.91 — the daily R1 — would signal the post-IPO selloff is losing its grip. Confirmation would come from the hourly MACD crossover extending and RSI climbing back through 50 on the 1H timeframe.
Disclaimer: This article is for informational purposes only and does not constitute financial advice, an investment recommendation, or a solicitation to buy or sell any financial instrument or cryptocurrency. The analysis provided is not indicative of future results. Investing in crypto assets and financial markets carries a high risk of capital loss. Always do your own research (DYOR) and consult a qualified financial advisor before making any decision.
Article produced with the assistance of artificial intelligence and reviewed by the editorial team.
