




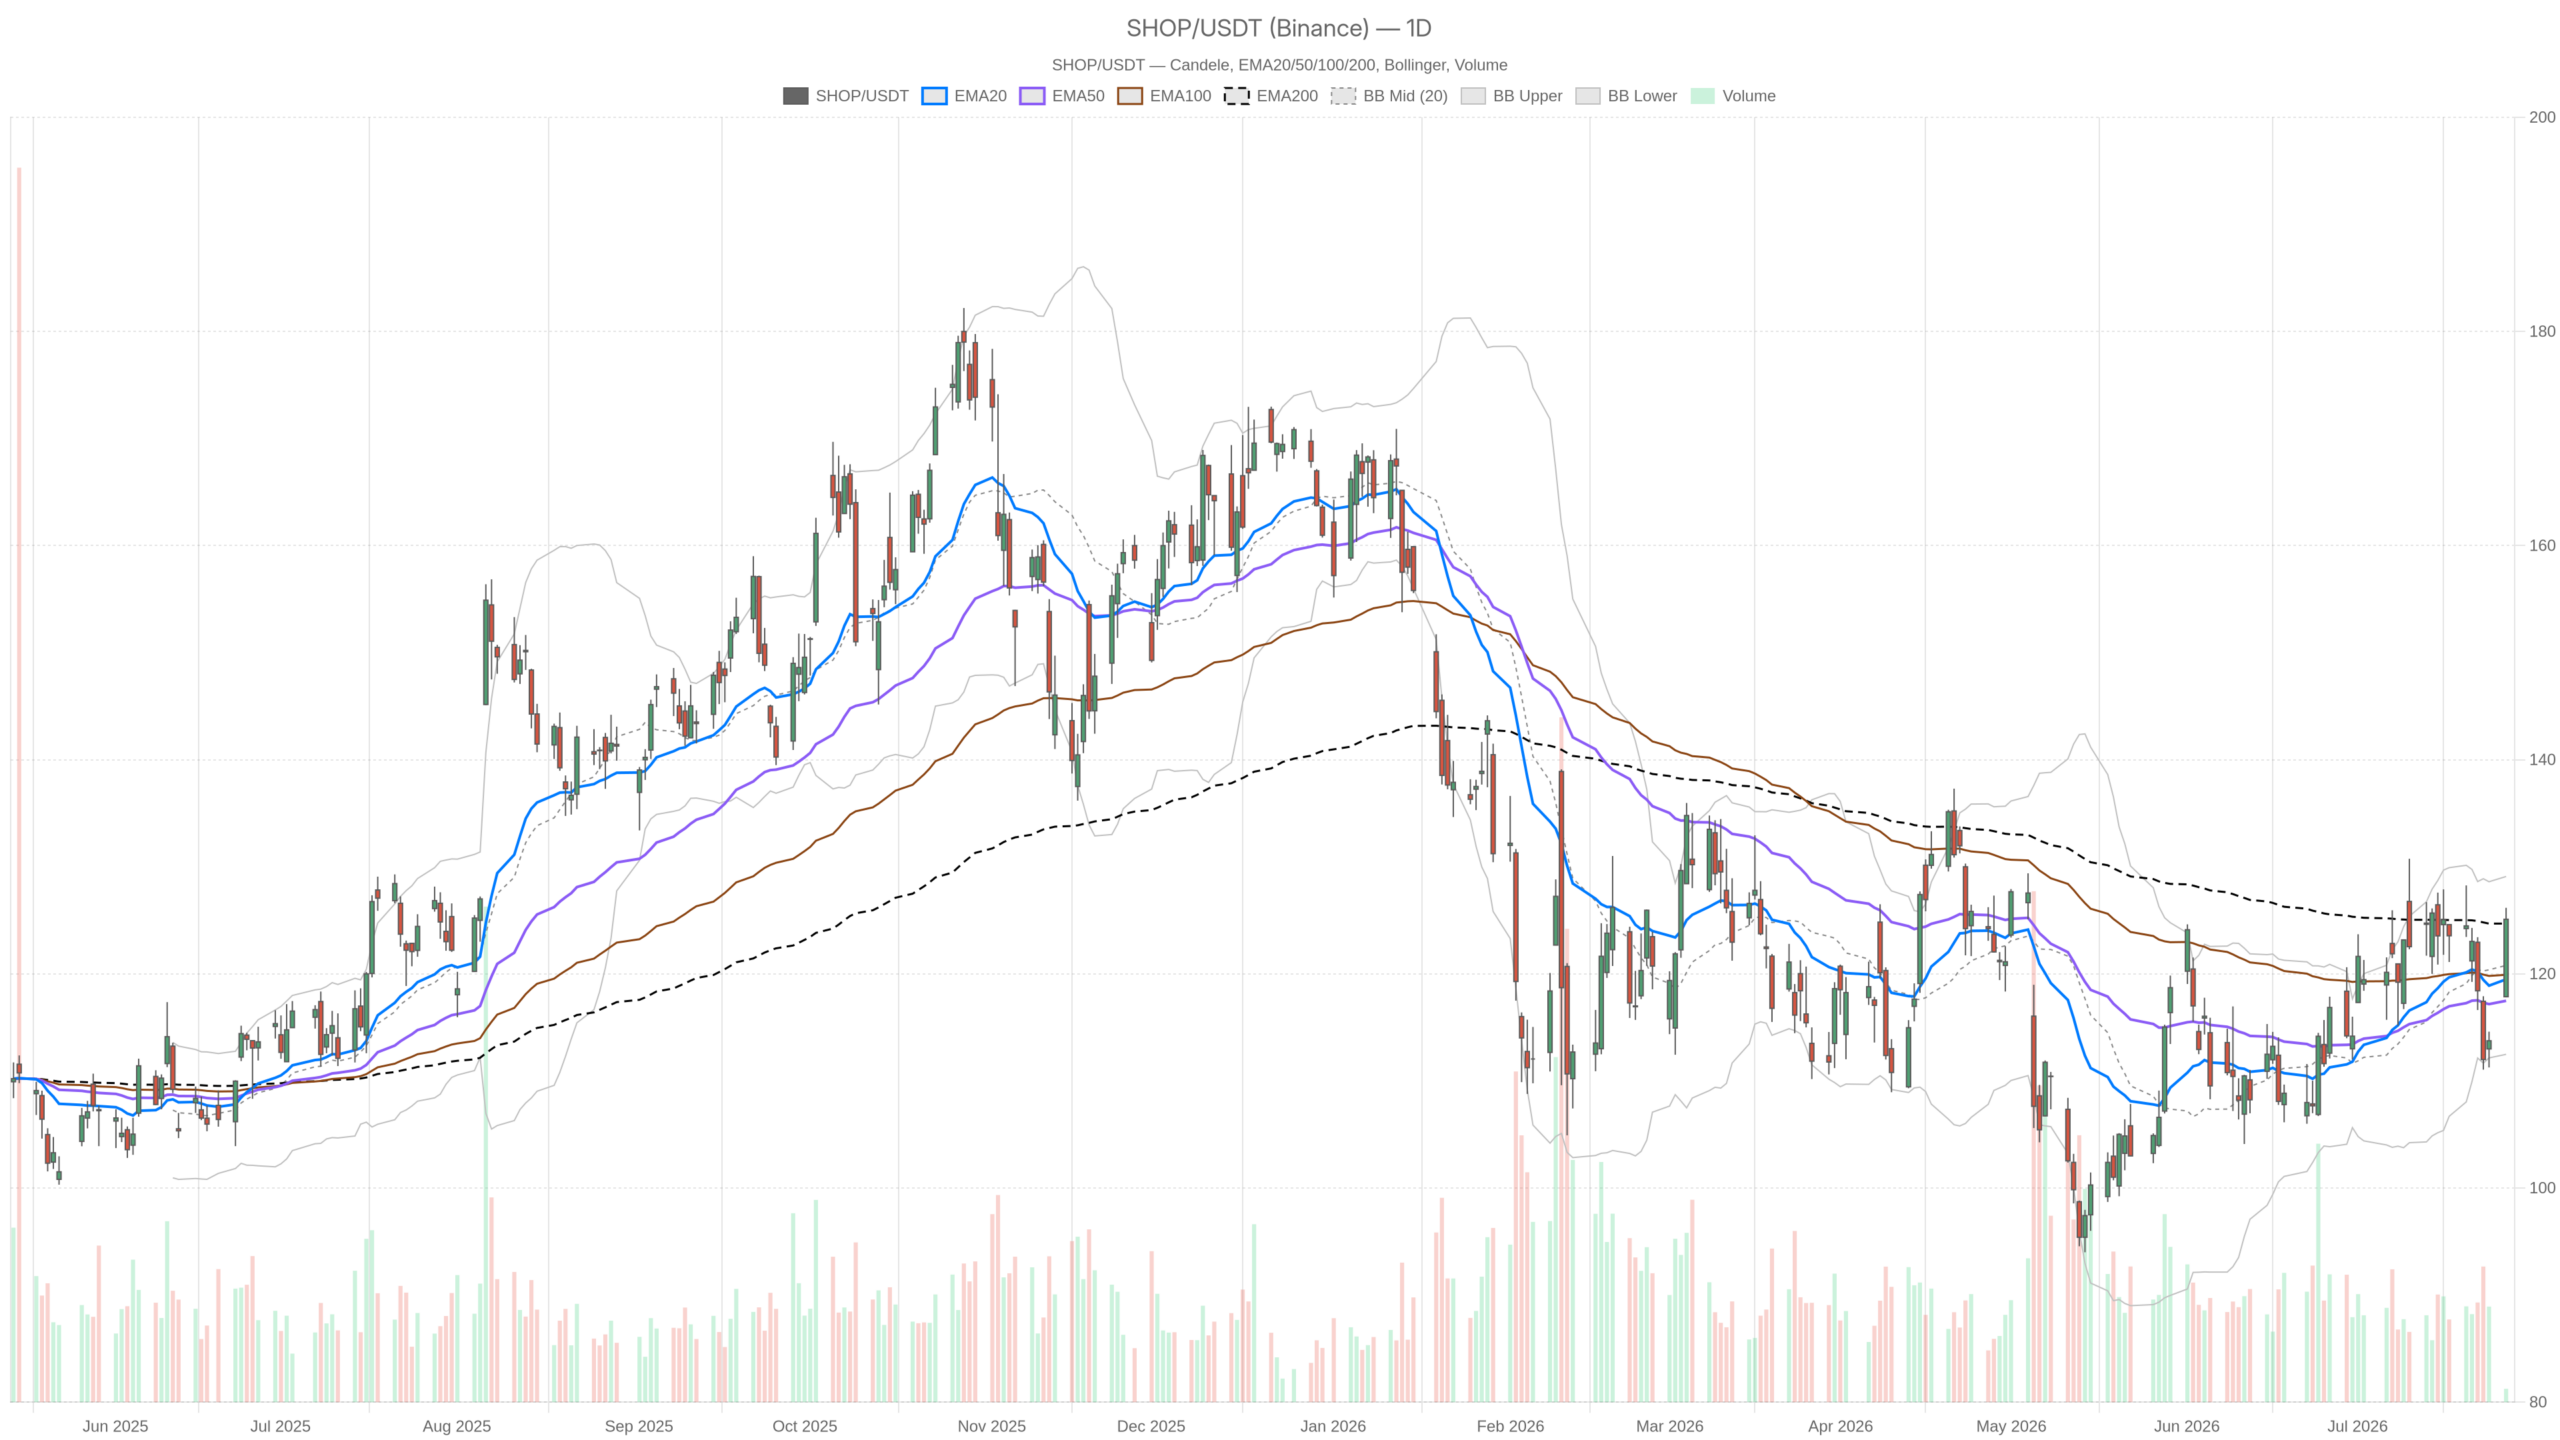
Shopify Inc. stock closed at $125.10 on July 27, surging from $117.86 to an intraday high of $126.17. This $8.36 range expansion places SHOP at a critical crossroads, pressing against both the daily EMA200 and the upper Bollinger Band.
Summary
Key takeaways
- SHOP closed at $125.10 on July 27, rising sharply from an open of $117.86.
- Price is pressing against the daily EMA200 at $124.70 — a historically significant resistance level.
- Daily RSI at 57.53 supports moderate bullish lean; MACD histogram at -0.76 signals fading momentum.
- Hourly RSI at 69.99 approaches overbought; 15-minute RSI at 74.97 is firmly overbought.
- The next two to three daily closes around $124.70–$126.17 will be decisive for SHOP’s medium-term trajectory.
Daily Bias: Structurally Improving, But Not Yet Confirmed
The daily bias for Shopify Inc. stock reads as cautiously constructive. Short-to-medium-term trend pressure points upward, but the real test lies just ahead.
The EMA20 sits at $119.49 and the EMA50 at $117.48 — both well below current price. This confirms that short-to-medium-term trend pressure is to the upside. However, the EMA200 at $124.70 has acted as a natural ceiling for years. Price closing above it at $125.10 is meaningful, but only barely so.
Momentum Indicators Flash Mixed Signals
The daily RSI at 57.53 supports a moderately bullish lean without reaching overbought territory. There is still room to run before momentum becomes overextended. Meanwhile, the MACD tells a more nuanced story. The MACD line at 1.37 sits below the signal at 2.13, producing a histogram of -0.76. That negative reading confirms momentum is fading at the daily level, even as price pushes higher. Buyers are winning the battle, but losing some energy in the process.
Volatility Context and Pivot Levels
At the same time, Bollinger Bands on the daily frame show the upper band at $129.10, with the mid-band at $120.79. Price trading near the upper band suggests the recent move has been significant. The ATR14 at $6.39 reflects elevated daily volatility — wide enough to shake out weak hands on any session. The daily pivot point sits at $123.03, with R1 at $128.25 and S1 at $119.88. Price is trading above the pivot and approaching R1, which now becomes the next logical target in the bullish scenario.
Hourly Picture: Momentum Surges, Overbought Risk Emerges
The hourly chart shows aggressive bullish momentum, but overbought conditions are now flashing a clear warning. The RSI sits at the edge of overbought territory.
The RSI reads 69.99 — right at the edge of overbought. That signals aggressive intraday momentum. The MACD on this timeframe is strongly positive, with the line at 1.23 above the signal at -0.55, driving a histogram of 1.78. Short-term momentum is unambiguously bullish on the hour chart.
At the same time, price at $125.10 trades well above all three hourly EMAs. The EMA20 sits at $118.90, the EMA50 at $119.59, and the EMA200 at $118.17. That alignment is a textbook bullish stack. However, the gap between current price and those moving averages is wide. Stretched conditions like this often precede either consolidation or a swift mean-reversion move.
Notably, the 1H Bollinger upper band sits at $126.24 — essentially where price tested its high. That band now acts as immediate resistance. A close above it on the hourly chart would signal genuine breakout strength. A rejection here, on the other hand, would be the first technical warning sign for bulls.
15-Minute Frame: Execution Context Shows Heat
The 15-minute chart reveals clear near-term exhaustion risk for Shopify Inc. stock. The RSI is firmly overbought and a micro-divergence is forming.
The RSI on this timeframe sits at 74.97 — firmly overbought. The MACD histogram has turned marginally negative at -0.12, with the line at 2.45 just below the signal at 2.57. That micro-divergence is small, but worth noting. It suggests the sprint may be pausing, even if the broader intraday trend remains intact.
Therefore, for traders, this is not an ideal entry point on an impulse buy. The 15-minute frame is best used as a signal to wait for a cooling period. A pullback toward the $124.67 support pivot or the $123.54 mid-Bollinger level would offer a better setup before establishing or adding to positions.
The Fundamental Catalyst Layer
Shopify’s fundamental backdrop is quietly strengthening through ecosystem integrations. New fulfillment and sales-channel partnerships are extending the platform’s reach.
On the news front, Shopify is seeing a steady stream of ecosystem-building announcements. DSCP Smart Fulfillment recently launched native fulfillment technology specifically for Shopify merchants. It offers real-time inventory visibility and automatic order routing. That kind of deep platform integration reduces operational friction and strengthens merchant stickiness.
Notably, DoorDash’s marketplace is now a native sales channel within Shopify’s App Store. This allows US-based brick-and-mortar merchants to sync catalogs, inventory, and fulfillment directly. The integration extends Shopify’s omnichannel reach into local commerce. Wall Street has maintained a broadly constructive stance, with the average brokerage recommendation leaning toward a buy on SHOP stock.
Bullish Scenario: Breakout Holds, R1 Becomes the Target
The bullish case for Shopify Inc. stock depends on the daily close above the EMA200 holding firm. If it does, R1 at $128.25 becomes the next credible target.
In this scenario, price would consolidate in the $124–$125 zone without significant selling. If the daily MACD histogram begins to recover toward neutral or positive, the path toward R1 at $128.25 becomes credible. The upper Bollinger at $129.10 would then come into sight. The platform news — DoorDash integration, native fulfillment tools, sustained analyst buy ratings — provides a supportive fundamental backdrop. This could attract institutional buying on any minor dip.
Bearish Scenario: EMA200 Rejection and Momentum Fade
The bearish scenario is straightforward: the EMA200 has a strong historical record as resistance. A failure at this level would open the door to a sharp reversal.
In contrast, if buyers fail to defend the $124.70–$125.00 zone over the next one to two sessions, a sharp reversal becomes plausible. Price could quickly retreat toward the daily pivot at $123.03 — or even S1 at $119.88. The daily MACD’s negative histogram already hints the move may be running on fumes. A deterioration in the 1H RSI from near-overbought levels would compound the risk. Combined with a loss of hourly pivot support at $124.67, this would invalidate the bullish read quickly.
Positioning Amid Stretched Conditions
Shopify Inc. stock sits at an inflection point that demands discipline over conviction. The next two to three daily closes around the $124.70–$126.17 range will be decisive.
Overall, Shopify stock is at an inflection point that demands discipline rather than conviction. The daily structure is improving, but the EMA200 resistance and fading MACD histogram introduce genuine ambiguity. The hourly timeframe shows powerful momentum. Yet overbought RSI levels suggest the move is overdue for at least a brief pause. The 15-minute chart confirms short-term heat. With daily ATR at $6.39, volatility remains high enough to punish poorly timed entries. The next two to three daily closes around $124.70–$126.17 will be decisive for SHOP’s medium-term trajectory.
FAQ
What is the daily bias for Shopify Inc. stock right now?
The daily bias reads as cautiously constructive. Price closed at $125.10 above the EMA200 at $124.70, but only marginally. The daily RSI at 57.53 supports moderate bullish lean, though the MACD histogram at -0.76 signals fading momentum.
Is Shopify Inc. stock overbought?
On the daily timeframe, no — the RSI at 57.53 remains in neutral-bullish territory. However, on the 1H chart, the RSI sits at 69.99 near overbought, and on the 15-minute chart it is firmly overbought at 74.97. This suggests intraday conditions are stretched.
What are the key resistance levels for SHOP?
The immediate resistance is the daily EMA200 at $124.70, which price has just closed above. Above that, R1 sits at $128.25 and the upper daily Bollinger Band at $129.10. On the hourly chart, the upper Bollinger Band at $126.24 is acting as near-term resistance.
What would invalidate the bullish case for Shopify Inc. stock?
A failure to hold the $124.70–$125.00 zone over the next one to two sessions would invalidate the bullish read. A breakdown below the daily pivot at $123.03, combined with 1H RSI deterioration and a loss of hourly pivot support at $124.67, would confirm a bearish reversal.
Disclaimer: This article is for informational purposes only and does not constitute financial advice, an investment recommendation, or a solicitation to buy or sell any financial instrument or cryptocurrency. The analysis provided is not indicative of future results. Investing in crypto assets and financial markets carries a high risk of capital loss. Always do your own research (DYOR) and consult a qualified financial advisor before making any decision.
Article produced with the assistance of artificial intelligence and reviewed by the editorial team.
