




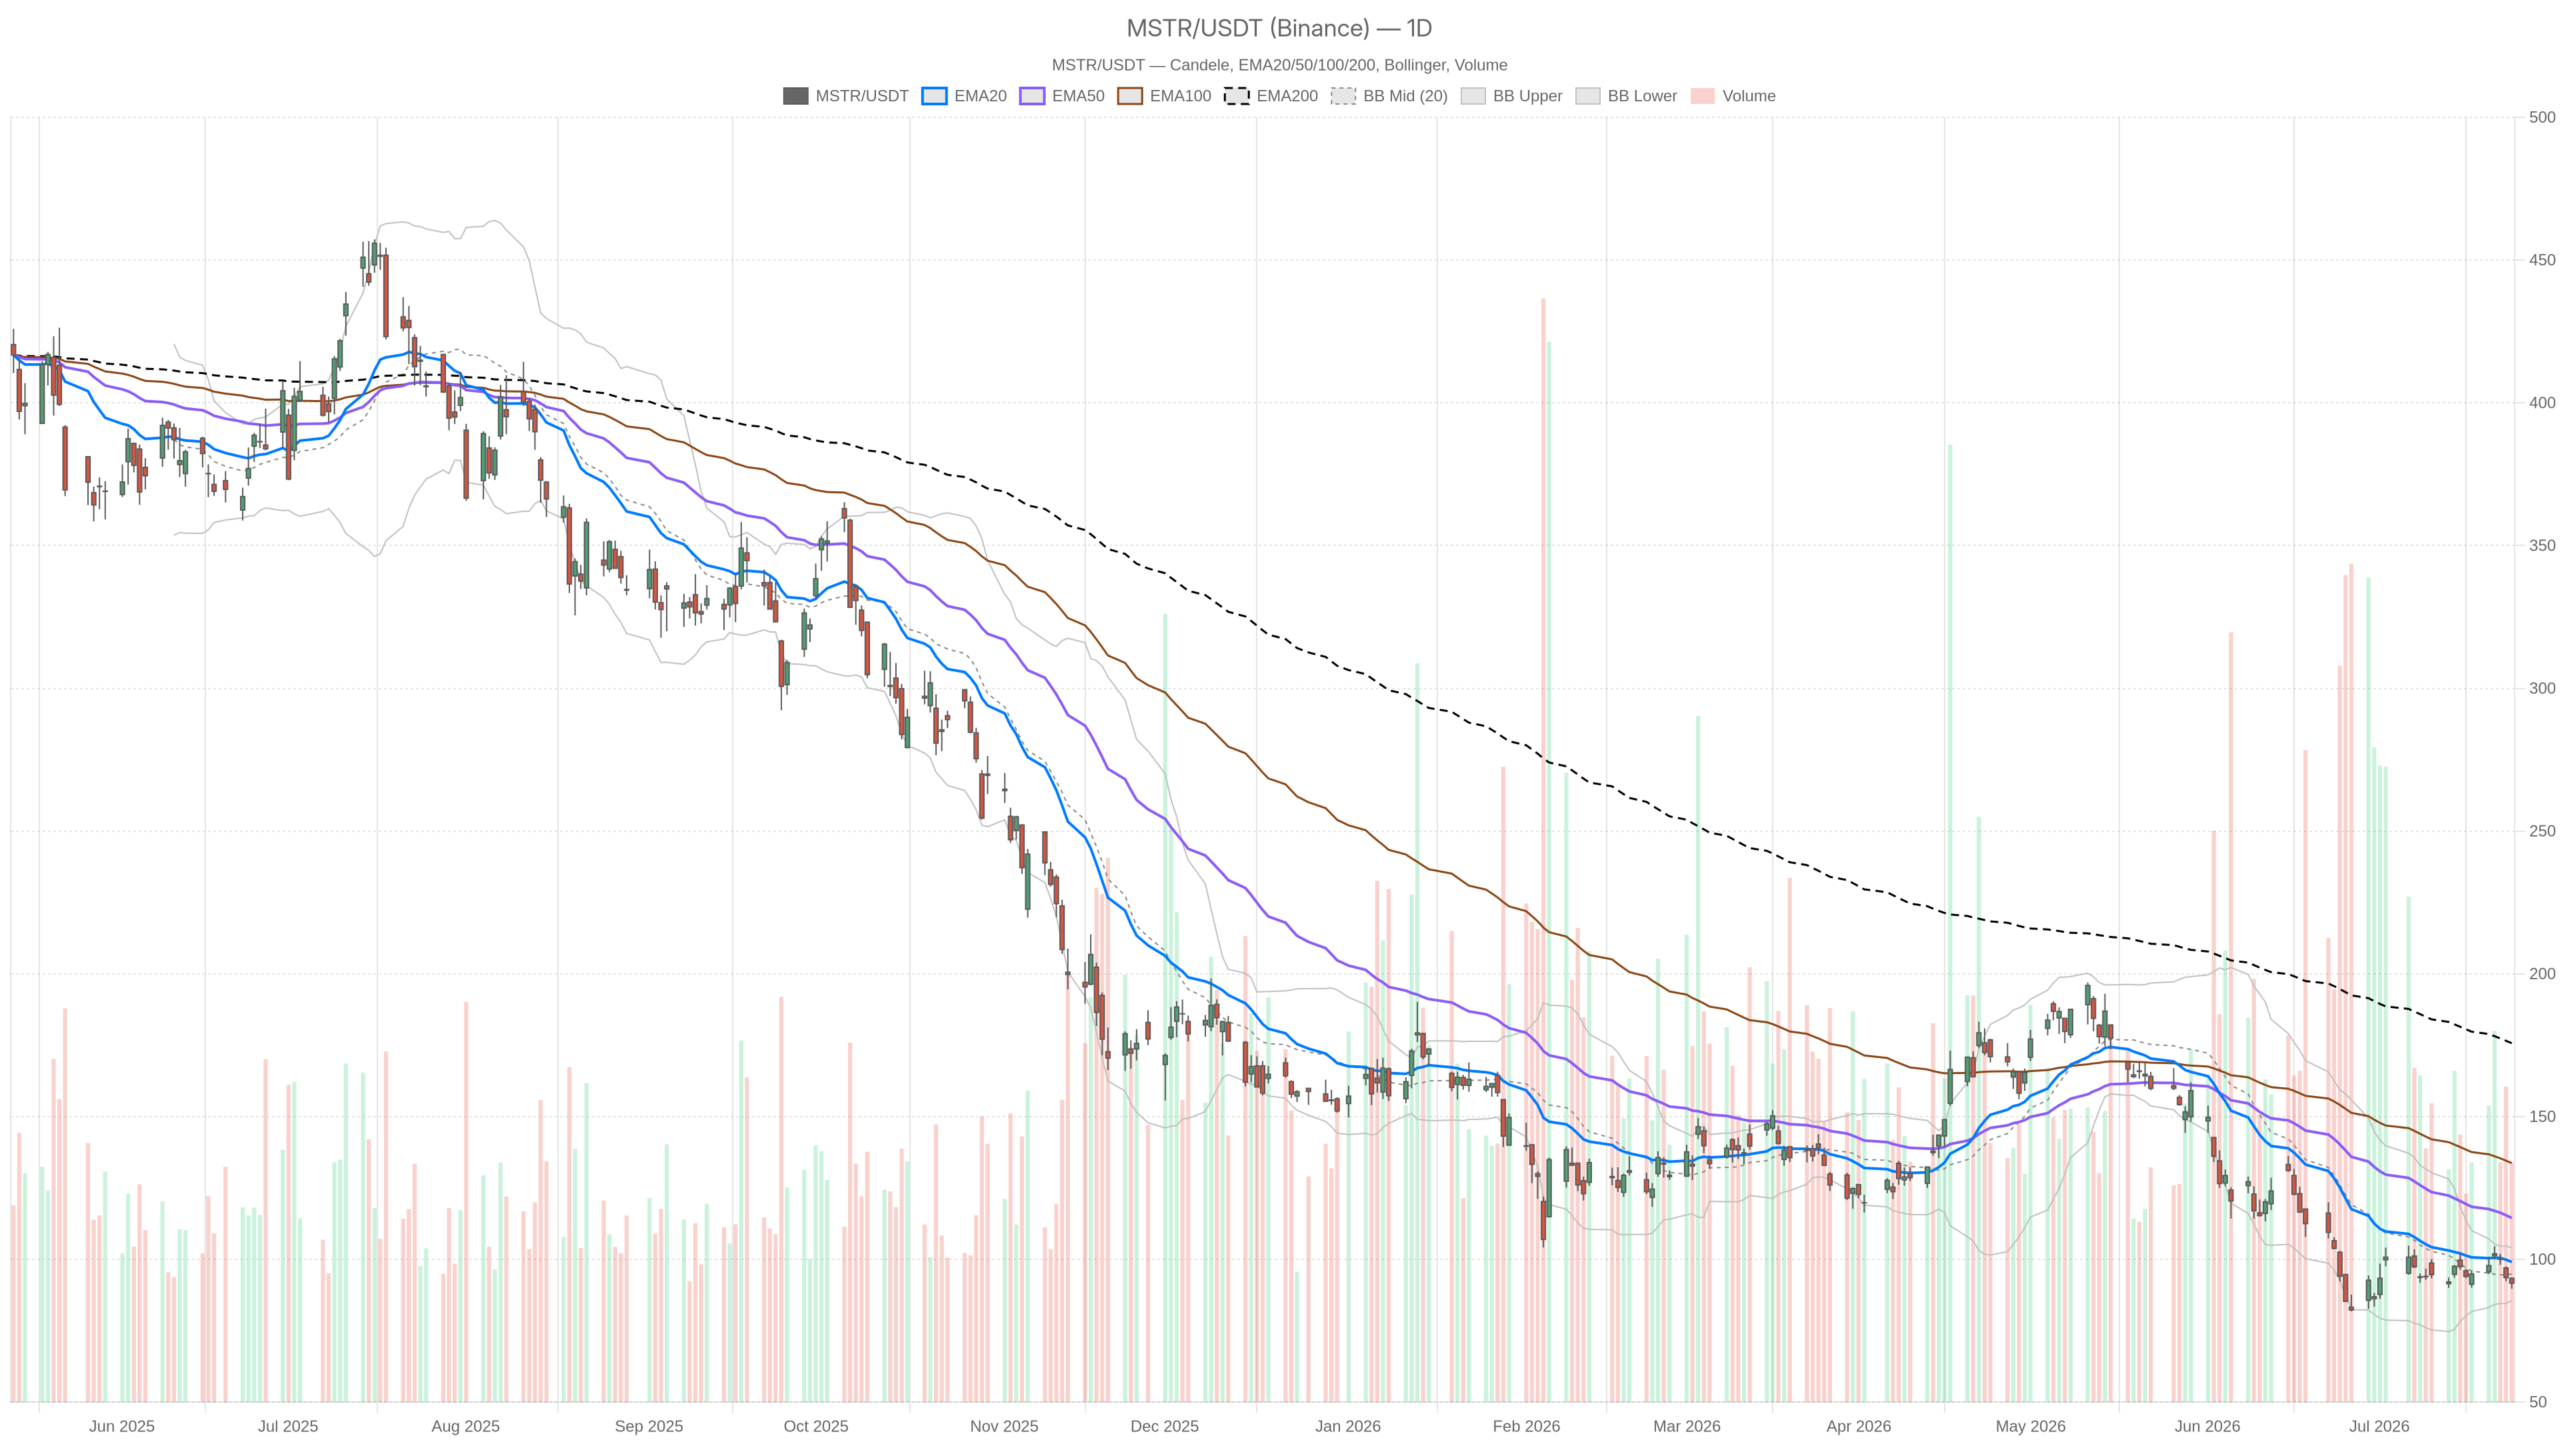
The Strategy stock closed at $91.67 on July 24, trapped below every major moving average. The bearish regime is confirmed across all timeframes — from daily down to the 15-minute chart. Sellers remain firmly in control, and recovery attempts have yet to gain traction.
Summary
Key takeaways
- MSTR closed at $91.67, below all daily EMAs — a fully aligned bearish stack
- Daily RSI at 39.14 signals continued weakness, not yet a bottom
- Daily MACD histogram turned positive (+1.8), the sole constructive signal
- Immediate support sits at $89.73, resistance at $93.65
- Company holds a $3.225 billion reserve but remains heavily dependent on Bitcoin prices
Daily Timeframe: The Trend Is Unambiguously Bearish
The daily chart for Strategy stock is unambiguously bearish. Price sits below all three major moving averages in a fully aligned bearish stack.
Trend Structure and Momentum Signals
Price at $91.67 sits beneath the EMA20 at $99.09, the EMA50 at $114.51, and the EMA200 at $175.71. That is a fully aligned bearish stack — no ambiguity there. Each moving average acts as a ceiling. The distance to the EMA200 alone underscores just how far this stock has fallen from its prior highs.
At the same time, the daily RSI at 39.14 is approaching oversold territory but has not yet reached it. This matters. Selling pressure could still intensify before any meaningful technical floor forms. The RSI reading does not yet signal a bottom — it signals continued weakness with room to deteriorate further.
Meanwhile, the MACD offers a rare constructive signal. The MACD line stands at -5.9, the signal at -7.7, and the histogram has turned positive at +1.8. This histogram expansion hints at a possible deceleration in bearish momentum. However, both the line and the signal remain deep in negative territory. The crossover, while worth watching, has not yet confirmed a meaningful directional shift.
Key Levels and Volatility Context
Bollinger Bands place the midline at $94.89, with the lower band at $85.67. Current price is trading below the midline and pressing toward the lower half of the range. Notably, the ATR of 5.52 reflects meaningful daily volatility. Moves of that magnitude can happen quickly in either direction, compounding both opportunity and risk.
Daily pivot analysis sets the pivot point at $91.70, with resistance at $93.65 and support at $89.73. MSTR closed almost precisely at the pivot. A failure to hold this level opens the door to the $89.73 support area.
Hourly Confirmation: No Recovery Signal in Sight
The 1-hour chart reinforces the bearish thesis without reservation. All three hourly moving averages form another perfectly aligned bearish stack above price.
The 1H close also registered $91.67, sitting below the EMA20 at $94.56, EMA50 at $95.94, and EMA200 at $103.74. Once again, a perfectly aligned bearish stack across all three moving averages. The 1H RSI at 35.4 is even more oversold than the daily reading. In the context of a multi-timeframe bearish regime, this more likely reflects trend momentum rather than an imminent reversal.
The hourly MACD reinforces the caution. The histogram at -0.32 is negative and diverging, with the MACD line at -1.63 below the signal at -1.31. Unlike the slight daily divergence, there is no histogram improvement on the 1H. Therefore, the intraday structure offers no confirmation of any bullish stabilization.
Meanwhile, the 1H Bollinger midline is at $95.23. Price is trading well beneath it, near the lower band at $88.85. The 1H pivot point sits at $91.95, resistance at $92.36, and support at $91.27. MSTR is hugging the pivot with no visible momentum to clear even the nearest resistance.
15-Minute Context: Execution Landscape Remains Weak
The 15-minute chart offers no reprieve for bulls. All short-term moving averages slope downward and act as resistance.
The 15m close of $91.67 sits beneath the EMA20 at $92.57, EMA50 at $93.69, and EMA200 at $95.82. All three short-term moving averages are sloping downward. The 15m MACD histogram is marginally negative at -0.03 — effectively flat, but not turning positive. The RSI at 39.39 echoes the daily reading.
Notably, the 15m ATR is 0.63, suggesting tight intraday ranges. The Bollinger Bands are narrow — upper at $93.56, lower at $91.76 — with price pressing on the lower edge. This compression after a downtrend often precedes a breakdown rather than a bounce. For any tactical entry, the $91.35 support from the 15m pivot is the key intraday level to watch.
Strategy Stock: Corporate Developments Amid Price Decline
Corporate activity at Strategy remains robust despite the stock’s technical weakness. However, the market is currently pricing in risk, not optimism.
On the news front, Strategy joined BlackRock and Coinbase in forming the Bitcoin Security Consortium. Members collectively committed $15 million to research focused on protecting Bitcoin against quantum computing threats. The company also unveiled a new Bitcoin Banking Index. It introduced a novel metric — Net Bitcoin Per Share — designed to give common shareholders clearer visibility into Bitcoin exposure.
Additionally, Strategy has reportedly built a $3.225 billion dollar reserve. Analysts suggest this may ease near-term payment pressure. However, the same reports note that heavy debt, preferred stock obligations, and concentrated Bitcoin exposure keep overall financial risk elevated.
In short, the narrative around Strategy stock remains bold and Bitcoin-centric. Yet the market is currently pricing in risk, not optimism.
Bullish Scenario: What Would Need to Change
A bullish reversal in Strategy stock would require several sequential confirmations. None of them are currently in place.
First, MSTR needs to reclaim and hold the daily pivot at $91.70 convincingly. A push above the daily R1 at $93.65 would be the first structural signal that sellers are losing grip. Beyond that, the key test is the EMA20 at $99.09 on the daily chart. Until price closes above that level, any bounce remains a counter-trend move within a broader downtrend.
The daily MACD histogram already turning positive at +1.8 is the most constructive signal currently on the board. If this divergence develops into a full bullish MACD crossover, the setup gains credibility. The RSI climbing back above 45 would add further confirmation. The Bitcoin-related corporate announcements could serve as a catalyst. This is particularly true if Bitcoin itself rallies and re-rates MSTR’s implied asset value.
Bearish Scenario: The Path of Least Resistance
The bearish path remains the default for MSTR until proven otherwise. Failure to hold daily support at $89.73 would deepen the technical damage significantly.
Below that level, the lower Bollinger Band at $85.67 becomes the next reference point. With the EMA200 sitting at $175.71, there is no structural support from long-term trend buyers anywhere near current prices. The stock is essentially in free fall from a moving average perspective.
The $3.225 billion reserve is reassuring for near-term liquidity concerns. Still, it does not eliminate the structural risk of a company whose balance sheet is overwhelmingly concentrated in Bitcoin. A sustained Bitcoin selloff would neutralize any dollar reserve comfort quickly.
Positioning, Volatility, and the Weight of Uncertainty
Strategy stock presents a technically compromised picture across all timeframes. The bearish regime is consistent, the moving averages are stacked against buyers, and the hourly structure provides no meaningful recovery signal.
The one constructive data point — the daily MACD histogram turning positive — is a small flicker in an otherwise dark chart. Volatility, as measured by the daily ATR of 5.52, is high enough to produce sharp intraday swings. That creates noise and risk around any short-term positioning.
The corporate narrative around Bitcoin infrastructure, new metrics, and institutional consortiums may eventually matter for valuation. Right now, the market is not rewarding that narrative. Traders and investors alike should treat the current setup with caution. The immediate range — $89.73 support to $93.65 resistance — defines near-term direction.
FAQ
Is Strategy stock currently in a bearish trend?
Yes. The bearish regime is confirmed across all timeframes — daily, hourly, and 15-minute. MSTR closed at $91.67 on July 24, below every major moving average on the daily chart.
What are the key support and resistance levels for MSTR?
Immediate support sits at $89.73, with the next level at the lower Bollinger Band of $85.67. Resistance stands at $93.65, followed by the EMA20 at $99.09 on the daily chart.
Is there any constructive signal for Strategy stock right now?
The daily MACD histogram has turned positive at +1.8, hinting at a deceleration in bearish momentum. However, both the MACD line and signal remain deep in negative territory, so no directional shift is confirmed.
What corporate developments has Strategy announced recently?
Strategy co-founded the Bitcoin Security Consortium with a $15 million research commitment, launched a Bitcoin Banking Index, introduced the Net Bitcoin Per Share metric, and built a $3.225 billion dollar reserve.
Disclaimer: This article is for informational purposes only and does not constitute financial advice, an investment recommendation, or a solicitation to buy or sell any financial instrument or cryptocurrency. The analysis provided is not indicative of future results. Investing in crypto assets and financial markets carries a high risk of capital loss. Always do your own research (DYOR) and consult a qualified financial advisor before making any decision.
Article produced with the assistance of artificial intelligence and reviewed by the editorial team.
