




KO Coca-Cola stock approaches Q2 earnings on July 28 with a bullish daily structure intact. Yet near-term exhaustion signals and pre-earnings uncertainty make the setup nuanced. Price holds above key moving averages, but the stock faces a genuine technical crossroads.
Summary
Key takeaways
- KO Coca-Cola stock closed at $84.07 on July 27, above all three daily EMAs
- The daily RSI at 56.77 signals sustained momentum without entering overbought territory
- Q2 earnings are due on July 28 before market open
- The hourly RSI at 67.29 is approaching overbought levels ahead of the report
- The daily ATR of 1.66 implies a potentially significant post-earnings range expansion
KO Coca-Cola Stock: Bullish Daily Structure Faces Earnings Test
KO Coca-Cola stock enters its July 28 Q2 report with a bullish daily structure intact. Near-term exhaustion signals, however, make the setup nuanced rather than straightforward. The daily trend is constructive, momentum remains positive, and price has held above key moving averages. At the same time, pre-earnings uncertainty and mild friction on shorter timeframes demand a measured approach.
Daily Timeframe: EMA Stack Reinforces Bullish Bias
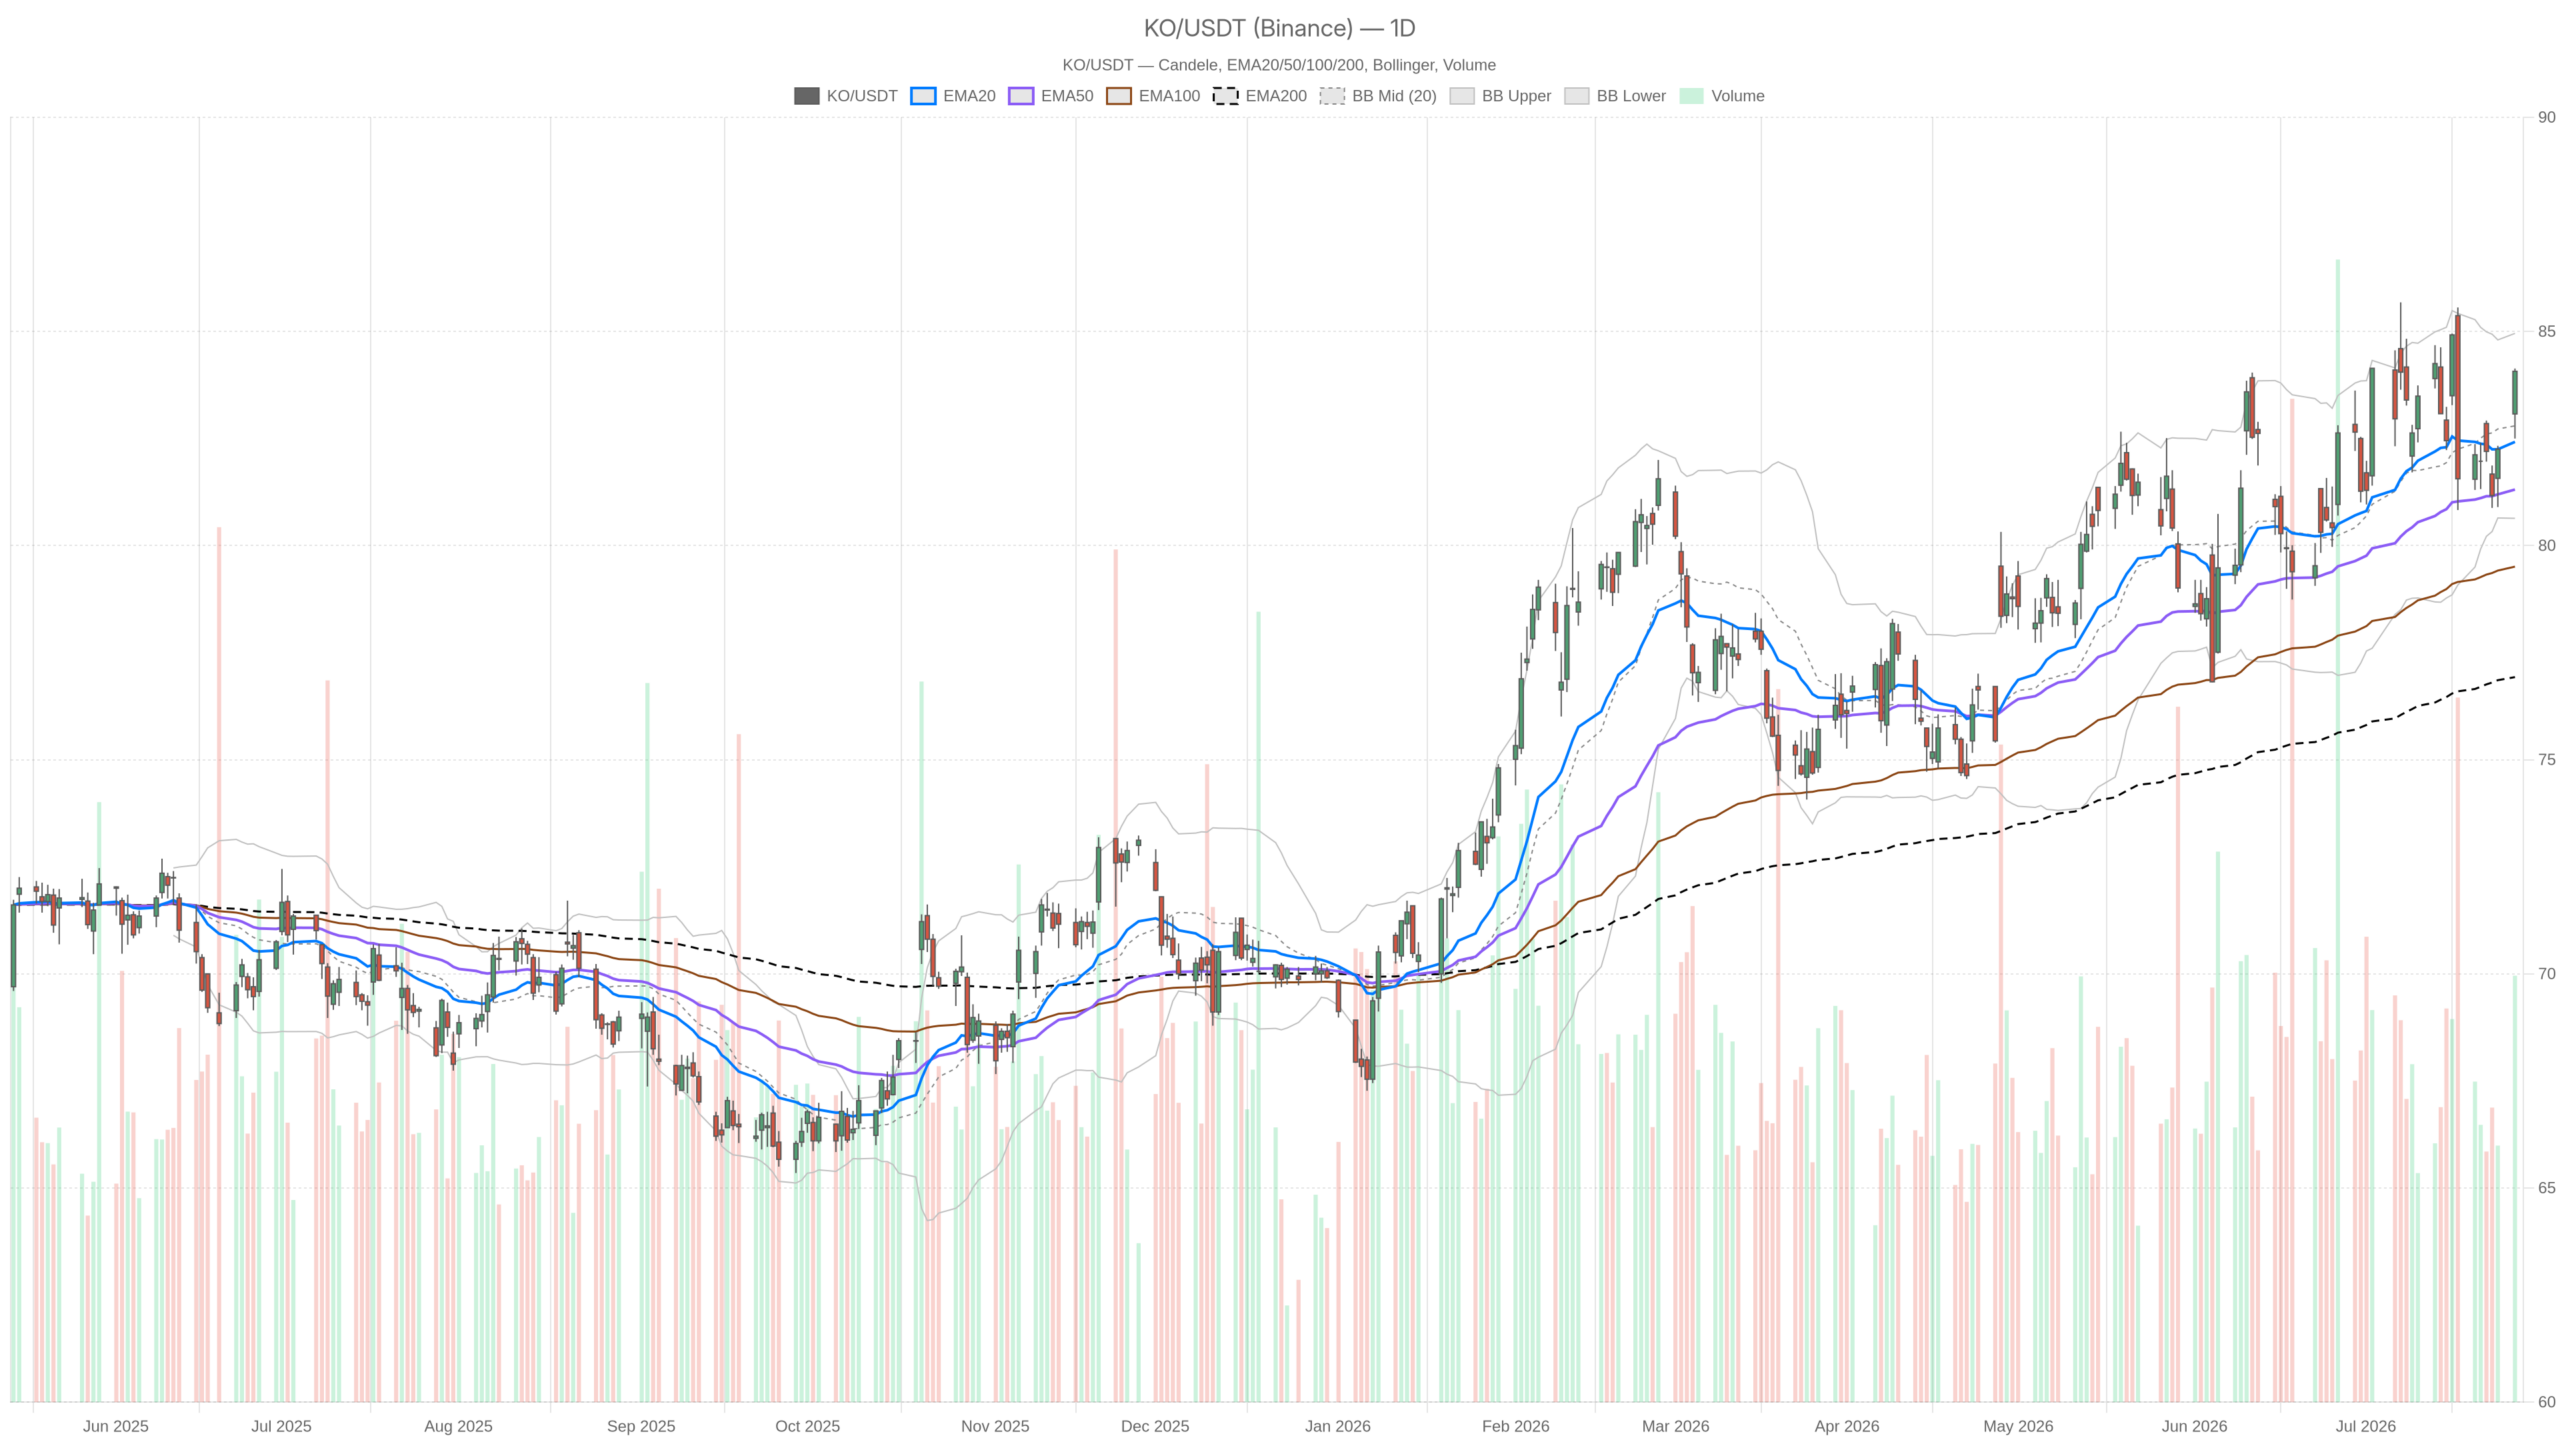
The daily chart confirms a firmly bullish bias for KO Coca-Cola stock. All three EMAs slope higher beneath price — the EMA20 at $82.42, the EMA50 at $81.31, and the EMA200 at $76.93. This stacked alignment, with price well above a rising EMA structure, is a textbook sign of trend health.
Meanwhile, the Bollinger Band midline at $82.80 has been left behind. Price is pushing toward the upper band at $84.96. The stock is not yet overextended against that upper band, but the gap is narrowing. That leaves limited room for further drift before the band itself becomes a natural friction zone.
The daily RSI at 56.77 is constructive. It signals sustained momentum without entering overbought territory, leaving room for further upside. However, the MACD histogram has turned marginally negative at -0.12. The signal line at 0.50 sits slightly ahead of the MACD line at 0.38. This is a mild divergence signal — not a reversal, but a sign that bullish momentum is not accelerating. The daily ATR of 1.66 reflects moderate volatility, consistent with a stock that moves with purpose but without erratic swings.
Pivot levels place key reference points at PP $83.57, R1 $84.64, and S1 $83.00. With price above the pivot and testing R1, bulls are in control of the near-term range. A sustained hold above $83.57 reinforces the bullish case. A slip below $83.00 would warrant closer attention.
Hourly Timeframe: Momentum Confirms but Overbought Risk Rises
The hourly chart aligns with the daily bullish bias for KO stock. Price at $84.11 sits above all three hourly EMAs. The EMA20 stands at $82.85, the EMA50 at $82.57, and the EMA200 at $82.20. This well-aligned EMA stack reinforces the uptrend structure across timeframes.
On the momentum side, the hourly MACD is constructively positioned. The MACD line at 0.52 sits above the signal at 0.28, with a positive histogram of 0.24. This is the opposite of what the daily MACD shows. The short-term push is still gathering speed even as the daily histogram fades. That divergence between timeframes is worth noting, though it does not yet constitute a conflict strong enough to challenge the broader bias.
In contrast, the hourly RSI at 67.29 is approaching overbought territory. It has not crossed 70, but the proximity matters — especially ahead of a binary event like earnings. A stock running hot into a report can sell off sharply on a minor guidance miss, regardless of headline numbers. The hourly Bollinger upper band at $84.58 is now just cents above current price, adding another layer of near-term resistance. Meanwhile, the ATR at 0.49 on the 1H suggests tight intraday movement — a calm before what could be a significant post-earnings range expansion.
15-Minute Timeframe: Micro-Exhaustion Signals Caution
The 15-minute chart reveals micro-exhaustion in KO Coca-Cola stock. The RSI has crossed into overbought territory at 70.3, and the MACD histogram has turned fractionally negative at -0.04. These signals suggest the short-term move may be losing steam at current levels.
Price is pressing against the 15m upper Bollinger Band at $84.16 and bumping the R1 pivot at $84.19. These confluent resistance levels, just above the current close, create a natural short-term ceiling. For traders, this is not an ideal entry point for momentum longs. The 15m picture does not alter the daily thesis. However, it does caution against chasing KO shares at current prices in the hours immediately preceding the earnings release.
Bullish Scenario: Earnings Beat Could Extend the Trend
A Q2 earnings beat could propel KO Coca-Cola stock above the daily Bollinger upper band at $84.96. This would extend the established uptrend into fresh territory. The bullish case is well-supported by both technical structure and fundamental backdrop.
Coca-Cola has beaten earnings estimates in four consecutive quarters. The company raised its dividend for the 64th consecutive year — a signal of financial confidence that resonates strongly with income-focused investors. Sentiment is reportedly at a 12-month low according to current news flow. This historically creates favorable asymmetry for a stock with consistent earnings delivery. If guidance meets or exceeds expectations on July 28, the stock could break above the daily Bollinger upper band. R1 at $84.64 would serve as an initial checkpoint. Above that level, price discovery into fresh territory becomes the operative scenario. The EMA structure and daily regime support this trajectory.
Bearish Scenario: Guidance Disappointment Could Reverse the Setup
A guidance disappointment could reverse the bullish setup for KO Coca-Cola stock. The daily pivot at $83.57 and S1 at $83.00 would become the initial downside targets. On the other hand, the bearish scenario hinges primarily on earnings, not technicals.
The daily MACD histogram has already turned slightly negative. The hourly RSI is near overbought. Price is pressing upper Bollinger resistance on multiple timeframes. These are not catastrophic signals, but they leave little technical buffer if a negative catalyst arrives. Notably, one source points out that the setups across reporting consumer companies diverge sharply. Guidance matters far more than a headline beat in the current environment. For KO specifically, any revenue or volume softness tied to consumer spending pressure could trigger a pullback. The daily pivot at $83.57 and S1 at $83.00 would be the initial targets. A close below the EMA20 at $82.42 would meaningfully weaken the daily bullish regime. That level should be watched closely in any post-earnings selloff scenario.
Positioning and Volatility: What to Expect Post-Earnings
KO Coca-Cola stock enters its Q2 report from a position of technical strength. The daily trend is clean, the EMA structure is aligned, and momentum — while not accelerating — has not broken down. The core thesis is bullish, anchored by a stacked EMA setup and a stock that has consistently delivered for shareholders.
However, the 15m overbought RSI, the near-term Bollinger ceiling, and the daily MACD histogram in mild negative territory all point to a stock that has priced in some optimism. The market has front-run the event to some degree. The daily ATR of 1.66 implies that a post-earnings move could be significant in either direction. Traders and investors should respect that uncertainty. The technical framework supports holding a bullish bias. But the earnings release on July 28 is the single variable that will determine whether current levels represent a launchpad or a near-term top.
FAQ
When does KO Coca-Cola report Q2 earnings?
KO Coca-Cola reports Q2 earnings on July 28 before market open.
What is the current technical trend for KO stock?
The daily chart shows a firmly bullish trend. Price at $84.07 sits above the EMA20 ($82.42), EMA50 ($81.31), and EMA200 ($76.93), all sloping higher.
What are the key price levels to watch after KO earnings?
On the upside, R1 at $84.64 and the daily Bollinger upper band at $84.96. On the downside, the daily pivot at $83.57 and S1 at $83.00. A close below the EMA20 at $82.42 would weaken the bullish regime.
Is KO stock overbought heading into earnings?
The 15-minute RSI has crossed 70.3, signaling micro-exhaustion. However, the daily RSI at 56.77 remains constructive and has not entered overbought territory.
Disclaimer: This article is for informational purposes only and does not constitute financial advice, an investment recommendation, or a solicitation to buy or sell any financial instrument or cryptocurrency. The analysis provided is not indicative of future results. Investing in crypto assets and financial markets carries a high risk of capital loss. Always do your own research (DYOR) and consult a qualified financial advisor before making any decision.
Article produced with the assistance of artificial intelligence and reviewed by the editorial team.
