




Caterpillar, Inc. stock surged after record quarterly revenue above $20 billion and raised 2026 guidance on data center demand. The earnings beat triggered an aggressive gap higher. Yet the daily candle reveals a more complicated picture than the headline suggests.
Summary
Key takeaways
- Caterpillar reported record quarterly revenue above $20 billion for the first time and raised its 2026 sales growth target.
- The stock opened at 923.77, spiked to 932.29, then faded to close at 875.94 — a roughly 65-point range.
- Daily RSI14 sits at 48.26, neutral despite the bullish catalyst, and the daily MACD remains bearish with a negative histogram of -3.7.
- Price closed below the 50-day EMA at 891.83 and near the 20-day EMA at 875.61, leaving the medium-term structure unconvincing.
- Hourly RSI is at 74.49, overbought, while the daily ATR14 stands at 44.66, signaling elevated volatility ahead.
What the Daily Chart Reveals About Caterpillar, Inc. Stock
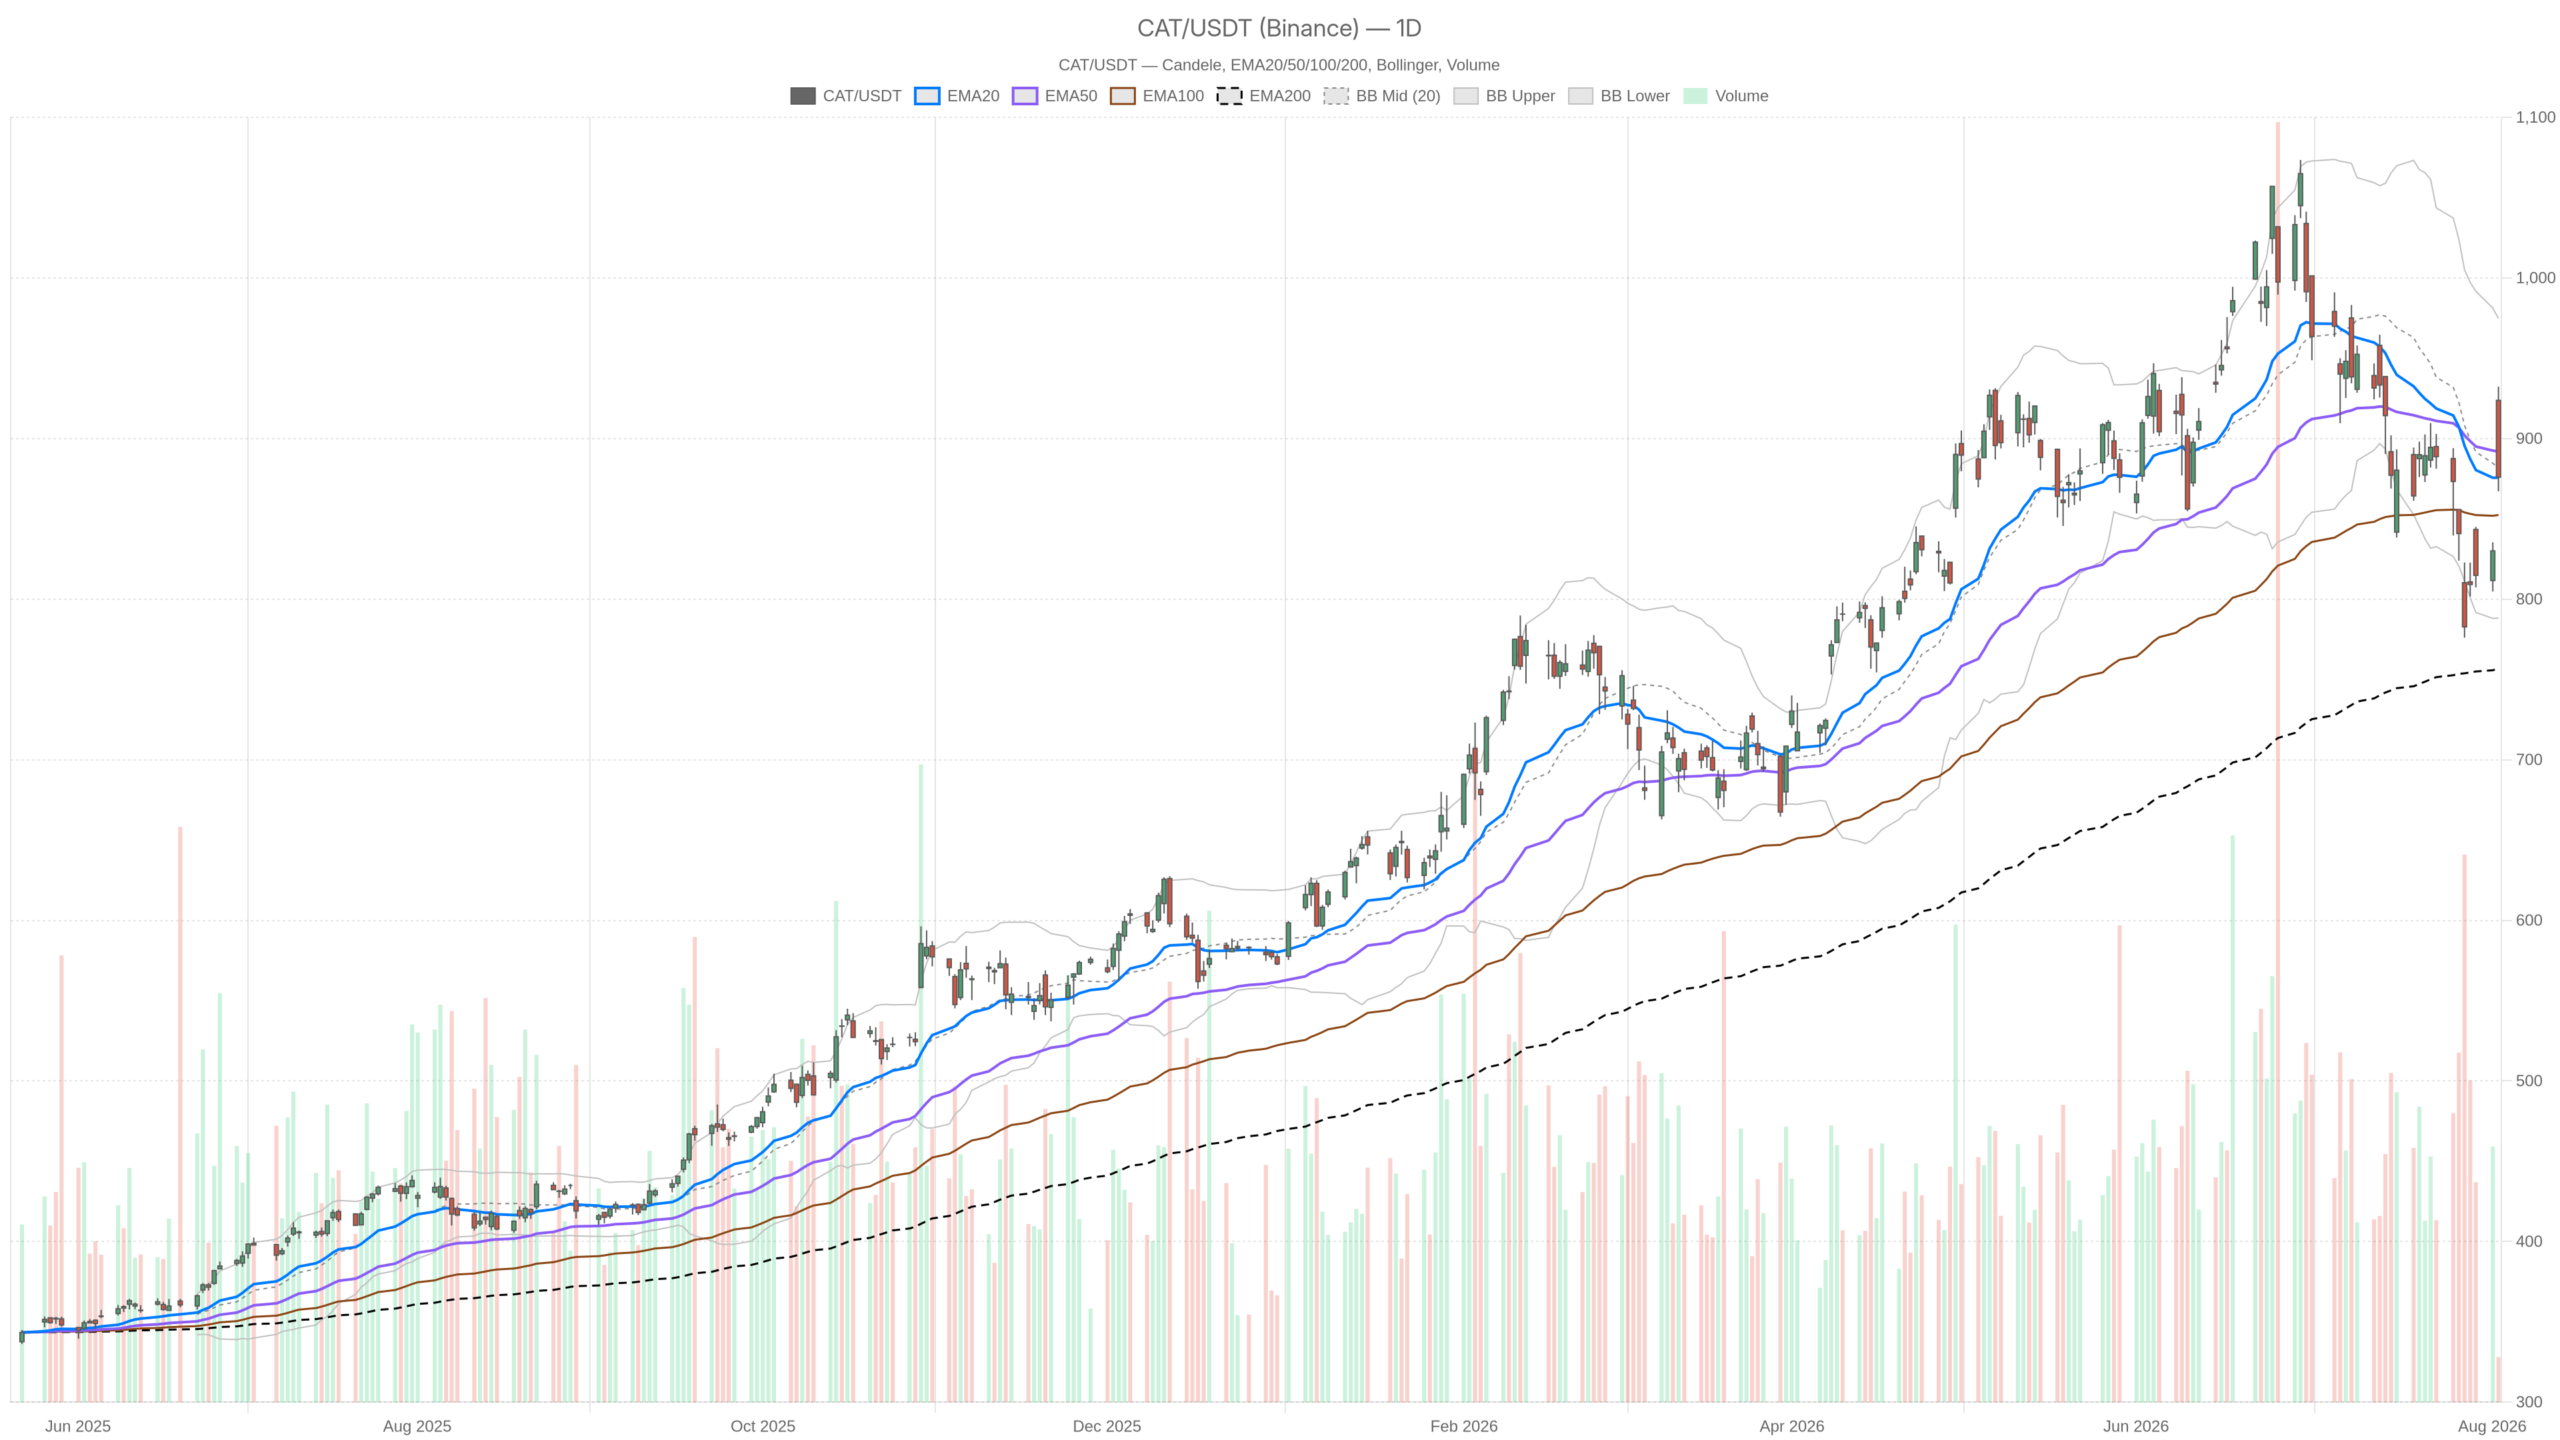
The daily chart for Caterpillar, Inc. stock reflects a neutral-to-bearish structure that has not yet confirmed the earnings rally. Price closed near the 20-day EMA but remains below the 50-day EMA, with momentum indicators still in negative territory.
The daily EMA structure reinforces this cautious tone. Price closed at 875.94, essentially on the 20-day EMA at 875.61. However, it remains below the 50-day EMA at 891.83. Meanwhile, the 200-day EMA sits far lower at 756.90, confirming the broader uptrend is intact on a longer horizon. In contrast, the medium-term picture is less convincing. Caterpillar, Inc. stock has spent recent sessions below its 50-day average. Tuesday’s rally, despite the scale of the catalyst, was not enough to reclaim that level decisively.
Momentum Indicators Stay Neutral Despite the Catalyst
Momentum on the daily chart is neutral, not euphoric. RSI14 sits at 48.26, essentially at the midpoint. This is unusual for a session driven by a record-revenue beat. The daily MACD remains bearish. The line at -28.64 sits below the signal at -24.94. The histogram is negative at -3.7. Therefore, even after the pop, the daily momentum indicator has not flipped positive. The market reacted to the news, but the underlying trend has not confirmed a genuine reversal.
Volatility and Pivot Structure Signal Two-Sided Risk
Volatility also tells a story. The daily ATR14 stands at 44.66, unusually elevated, reflecting the size of Tuesday’s range. Yet price closed near the middle Bollinger Band at 881.45. It sits well inside the 788.21 to 974.70 envelope. Despite a violent session, Caterpillar, Inc. stock did not stretch the daily bands. This leaves room for movement in either direction.
The daily pivot structure adds another layer of caution. The pivot point sits at 891.80 with support at 851.30. Caterpillar closed at 875.94, below the pivot and roughly midway toward support. That positioning, combined with a still-negative MACD, suggests near-term weakness sits beneath the surface of an otherwise bullish headline.
Hourly and Intraday Timeframes Show Stretched Momentum
The 1-hour chart confirms a powerful bullish reaction to earnings, but it also flags an overbought condition that increases the risk of a short-term pullback. The 15-minute chart shows consolidation near the pivot, with momentum gradually fading.
1-Hour Chart: Strong but Overbought
The 1H timeframe shows a very different tone from the daily chart. That divergence matters. RSI on the hourly is at 74.49, solidly in overbought territory. The hourly MACD is strongly bullish. The line at 7.68 sits well above the signal at 0.56, with a histogram of 7.13. Price at 875.94 is trading above the hourly upper Bollinger Band of 859.81. This is a clear sign of an extended move following the earnings catalyst.
At the same time, the hourly EMA200 sits at 890.40, above the current price. Even after this rally, Caterpillar, Inc. stock remains below its longer hourly average. This is a reminder that the stock was in a corrective phase heading into earnings. Overall, the 1H timeframe confirms the initial bullish reaction was powerful. But it also flags a stretched condition that increases the risk of consolidation before any further advance.
15-Minute Chart: Consolidation with Fading Momentum
On the 15-minute chart, price is consolidating tightly around the pivot at 875.61. Resistance sits at 876.82 and support at 874.73. The 15m EMA20 at 854.03, EMA50 at 836.99, and EMA200 at 837.66 are all stacked below current price. This confirms short-term bullish structure. RSI14 at 63.6 is firm but not extreme. MACD remains positive, though the histogram at 3.15 is narrowing slightly. This hints that the immediate push higher is losing some steam.
Bullish and Bearish Scenarios for Caterpillar, Inc. Stock
Caterpillar, Inc. stock faces two distinct scenarios. A bullish breakout requires reclaiming the 50-day EMA near 891.80, while a bearish reversal would be confirmed by a break below the 20-day EMA and S1 support at 851.30.
The Bullish Case: Reclaiming Key Levels
The bullish case rests on Caterpillar reclaiming the daily pivot and 50-day EMA. Both are clustered near 891.80. The next target would be the daily R1 at 916.43. That would require the daily RSI to turn higher from its current neutral 48.26 reading. The daily MACD histogram would also need to stop contracting. Fundamentally, the setup has real support. The company reported record revenue past $20 billion and raised its 2026 sales growth target tied to data center demand. As noted in related coverage, the business converts revenue into billions in free cash flow rather than burning it. If buyers absorb the current profit-taking and hold above the daily EMA20 at 875.61, the path toward retesting the highs near 932 becomes credible.
The Bearish Case: Sell-the-News Confirmation
The bearish scenario is the mirror image. A failure to hold the daily EMA20 near 875.61 would be the first warning. A break of the S1 support at 851.30 or the session low of 867.16 would confirm that Tuesday’s gap was a classic sell-the-news event. Given that the daily MACD is still negative and price remains under the 50-day EMA, that risk is not trivial. In that case, the hourly overbought reading would look less like strength and more like exhaustion after a one-day spike. The RSI at 74.49 and price above the upper Bollinger Band would reinforce this interpretation.
Overall, Caterpillar, Inc. stock sits at a genuine crossroads. A powerful fundamental catalyst confronts a daily chart that has not yet confirmed it. The conflict between bullish hourly momentum and the still-hesitant daily structure is the central tension to watch. Volatility, as measured by the elevated daily ATR, is likely to stay high in the sessions ahead. Positioning should account for further two-sided movement before the market fully digests this earnings reaction. Until the daily chart aligns with the strength seen intraday, uncertainty around direction remains elevated.
FAQ
Did Caterpillar beat earnings expectations?
Caterpillar reported record quarterly revenue above $20 billion for the first time and raised its 2026 sales growth target. The company cited surging data center demand as a key driver behind the raised guidance.
Why did Caterpillar stock fade after the initial gap higher?
Despite the bullish catalyst, the daily chart shows classic profit-taking behavior. Price spiked to an intraday high of 932.29 but closed at 875.94. The daily MACD remains bearish and RSI sits at a neutral 48.26, suggesting the rally was not confirmed by underlying momentum.
What are the key levels to watch for Caterpillar, Inc. stock?
The daily EMA20 at 875.61 serves as immediate support. The 50-day EMA at 891.83 and the daily pivot at 891.80 are the key resistance zone. Below, S1 support at 851.30 and the session low of 867.16 are critical levels. On the upside, the daily R1 at 916.43 and the recent high near 932 represent the next targets.
Disclaimer: This article is for informational purposes only and does not constitute financial advice, an investment recommendation, or a solicitation to buy or sell any financial instrument or cryptocurrency. The analysis provided is not indicative of future results. Investing in crypto assets and financial markets carries a high risk of capital loss. Always do your own research (DYOR) and consult a qualified financial advisor before making any decision.
Article produced with the assistance of artificial intelligence and reviewed by the editorial team.
