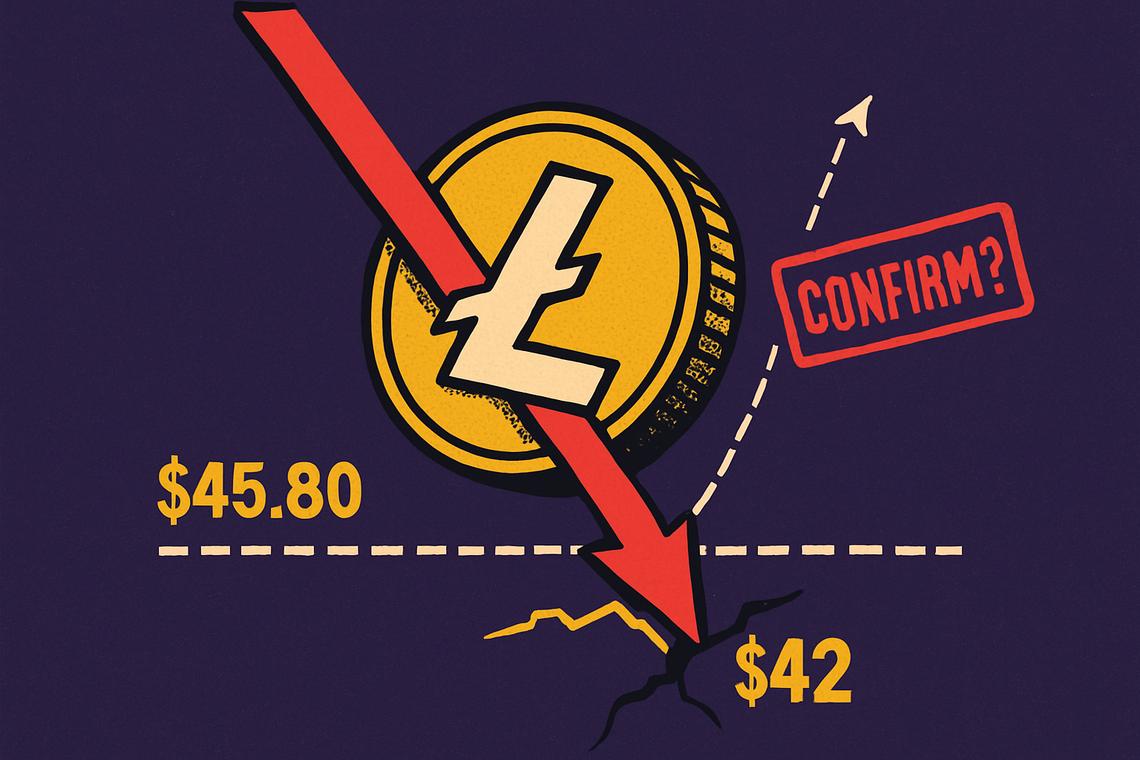
Litecoin traders are watching one number above all others right now: $45.80. That level has become the line separating another leg lower from a shot at recovery, and the broader Litecoin technical outlook still leans cautious. Analyst CryptoWZRD flagged the setup after Litecoin closed yet another indecisive daily session, describing intraday price action as weak and choppy while noting that Bitcoin sentiment remains the main force steering where Litecoin goes next.
Summary
Key takeaways
- Litecoin is stuck in a broader bearish market structure, with lower highs and lower lows visible across recent months.
- The $42.00 support zone keeps attracting buyers on pullbacks, which has so far prevented a deeper breakdown.
- $58.00 stands as the primary daily resistance bulls must reclaim to flip the trend, while $45.80 is the more immediate short-term hurdle.
- A breakout above a descending channel on the four-hour chart, plus improving MACD and RSI readings, hints at fading selling pressure — but confirmation is still pending.
- Bitcoin’s own price direction remains the biggest swing factor for Litecoin in the near term.
Litecoin Faces Persistent Bearish Market Structure
Litecoin’s daily chart still tells a story of sellers in control. The pattern of lower highs and lower lows that has defined recent months hasn’t broken, and previous attempts to recover stalled beneath key resistance zones before rolling over again.
Daily Price Trends with Lower Highs and Lows
That repeating pattern is the clearest sign the token hasn’t shaken off its downtrend. Each rally has run into selling before it could challenge the broader structure, which is why analysts continue framing bounces as corrective rather than the start of a new uptrend.
Support at $42.00 Preventing Deeper Declines
Despite the pressure, one level has held firm. The $42.00 support area keeps drawing buying interest whenever Litecoin dips toward it, and that demand has been enough to prevent a deeper slide so far. Losing that floor, according to the analysis, would only reinforce the existing downtrend.
Key Resistance Levels Define Potential Reversal Points
Two resistance levels matter most for anyone tracking Litecoin resistance levels right now: $58.00 on the daily chart, and $45.80 for shorter-term traders. Clearing either would mark a meaningful shift, but the bar sits higher the further out you look.
Primary Daily Resistance at $58.00
On the daily timeframe, $58.00 remains the ceiling bulls need to break to actually reverse the market structure. Until Litecoin reclaims that barrier, rallies are technically viewed as corrective bounces inside a downtrend rather than genuine trend changes.
Immediate Short-Term Resistance at $45.80 and Prospects for $48.00
Closer to current price action, $45.80 is the level short-term traders are watching most closely. A rejection there could open the door to another selling wave, with a downside target near $43.30. But holding above $45.80 would meaningfully change the near-term picture, potentially opening a path toward the $48.00 region on follow-through buying — especially if Bitcoin cooperates.
Technical Breakout and Momentum Indicators Signal Cautious Optimism
A modest but notable shift showed up on the shorter-term chart: Litecoin broke above a descending channel that had capped price for weeks, a signal that selling momentum may be fading. Momentum readings back that up, though neither confirms a full reversal on their own.
Four-Hour Chart Descending Channel Breakout
The four-hour chart produced the more encouraging development of the two timeframes. After persistent weakness, Litecoin pushed above its descending channel, a technical move that suggests the intensity of selling has started to ease. Trading volume picked up during that breakout, adding some credibility to the move, though volume remains relatively moderate overall. Whether that breakout holds depends on Litecoin continuing to defend the former channel resistance as new support — a failure there would expose the token to renewed downside pressure.
MACD and RSI Show Early Recovery but Require Confirmation
Momentum indicators have quietly improved after a stretch of bearish sessions. The MACD histogram has moved back into positive territory, and the MACD line is approaching a bullish crossover. RSI, meanwhile, bounced off levels near oversold territory and has climbed toward the mid-40s. These are among the cryptocurrency momentum indicators traders lean on most, and further gains above the 50 mark would strengthen the case for a genuine recovery. For now, though, both readings sit in an early-stage recovery zone that still needs more buying to confirm.
Market Outlook and Trading Strategy Recommendations
The overall message from current conditions is patience over aggression. Litecoin’s fate in the coming sessions is tied closely to what Bitcoin does next, and that dependency adds a layer of uncertainty that pure chart-reading can’t resolve on its own.
Role of Bitcoin Sentiment in Litecoin Price Direction
This is one of the clearest reasons the setup matters beyond Litecoin itself: Bitcoin sentiment remains the primary directional driver for near-term price movement across much of the altcoin market, and Litecoin is no exception. Stronger Bitcoin performance would likely improve the odds of Litecoin clearing $45.80 and pushing toward $48.00. A weaker Bitcoin, on the other hand, could just as easily drag Litecoin back toward its $42.00 support — or below it.
Risks of Support Level Failures and Advice for Patience
The broader Bitcoin market impact on altcoins like Litecoin is exactly why analysts are recommending caution rather than conviction trades right now. The technical signals — the channel breakout, the improving MACD, the RSI recovery — are encouraging, but none of them amount to confirmation yet. If Litecoin fails to hold its key support levels, renewed downside pressure could quickly erase the recent gains in momentum. That’s the tension defining the current Litecoin technical outlook: real signs of stabilization, sitting right alongside a bearish structure that hasn’t actually broken yet.
FAQ
What is the current overall trend of Litecoin?
Litecoin is in a broader bearish market structure with lower highs and lower lows recently, indicating persistent selling pressure.
Which support and resistance levels are critical for Litecoin’s price movement?
The $42.00 support level is crucial to prevent deeper declines, while $58.00 serves as the primary daily resistance that bulls must reclaim to reverse the trend. In the short term, $45.80 is the key resistance to watch.
How do momentum indicators like MACD and RSI reflect Litecoin’s current state?
MACD and RSI show early signs of recovery, with the MACD histogram turning positive and RSI climbing from oversold levels, but further buying activity is needed to confirm the recovery.
What role does Bitcoin sentiment play in Litecoin’s price outlook?
Bitcoin sentiment remains the primary directional driver for Litecoin’s near-term price movements, influencing whether the token can build on its recovery or fall back under renewed selling pressure.
Article produced with the assistance of artificial intelligence and reviewed by the editorial team.