




Lucid stock is trying to find its footing after a violent earnings-driven selloff, with two conflicting timeframes now at play. The daily chart shows tentative stabilization, while the hourly structure flashes renewed weakness. Combined with a sharp operational reset from management, this tension demands caution over conviction.
Summary
Key takeaways
- LCID closed at $6.70 on August 5 with an intraday range of $6.18 to $7.24
- Daily RSI14 sits at 49.4 — neutral and reflecting indecision across the primary timeframe
- Price trades more than 34% below the EMA200 at $10.24, confirming a structural downtrend
- Hourly MACD histogram at -0.11 signals active selling pressure on the lower timeframe
- CEO Silvio Napoli announced an operational reset targeting roughly $1.4 billion in cash-flow improvement for 2026
Daily Trend: A Fragile Stabilization Attempt
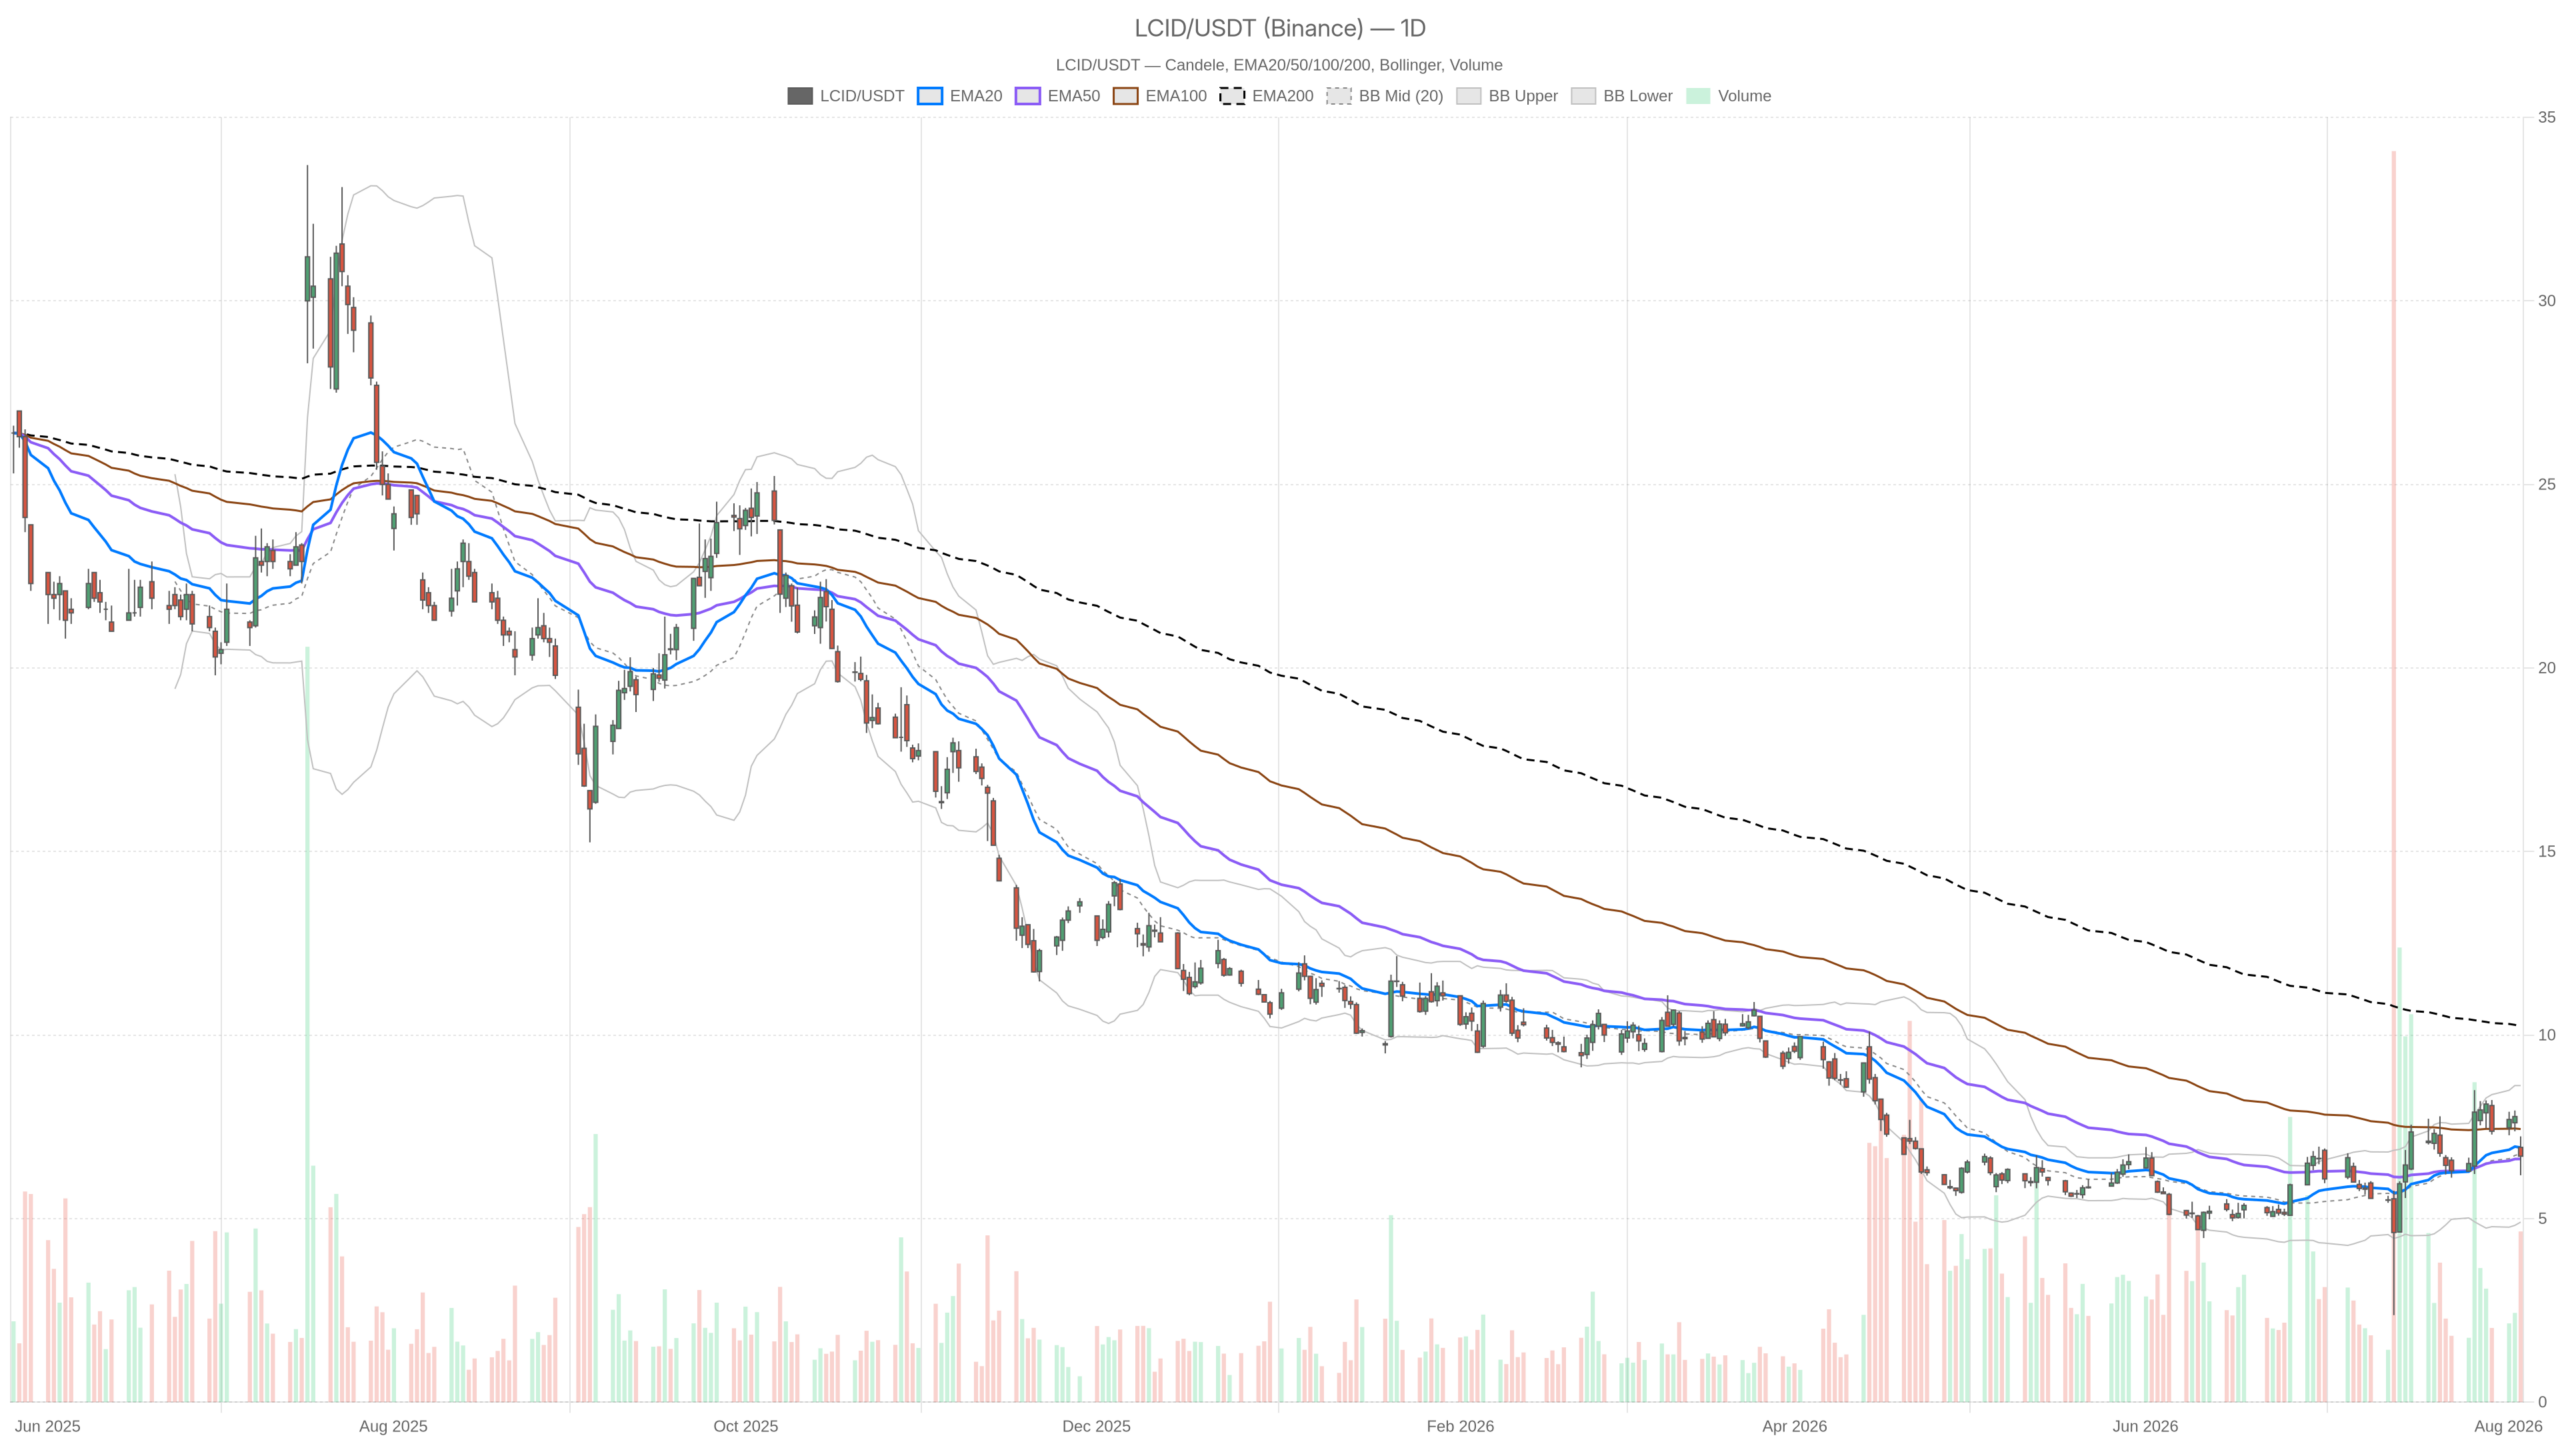
Lucid stock sits in a technically neutral zone on the daily chart. Price is hugging the EMA50 at $6.63 and trading just below the EMA20 at $6.94. Moving averages are converging rather than diverging, which typically signals indecision rather than trend. At 49.4, the RSI14 reinforces that read: neither overbought nor oversold, simply directionless.
Meanwhile, the daily MACD offers only a faint signal. The line sits at 0.41 versus a signal of 0.39, producing a histogram of just 0.02. That is technically a bullish crossover, but it is razor-thin. It should not be treated as a meaningful momentum shift. It is more of a pause than a turn.
However, the EMA200 at $10.24 cannot be ignored. Price trading more than 34% below that long-term average confirms the primary trend remains firmly bearish. Any daily-level stabilization must be read within that larger downtrend, not as evidence it has reversed.
Volatility Metrics and Fundamental Pressure
The daily Bollinger Bands add context on volatility. With the mid-band at $6.76, price is hugging the center of the range. The bands themselves have widened considerably, with the upper at $8.62 and lower at $4.90. That spread, combined with an ATR14 of $0.90, confirms a high-volatility environment. Single-session swings of a dollar or more are realistic. Pivot levels for the session sit at $6.71, with resistance at $7.23 and support at $6.17.
Notably, the session followed a Q2 2026 earnings call in which CEO Silvio Napoli detailed the operational reset. Management guided Q3 and Q4 production below Q2 levels. The stock reportedly dropped as much as 13.88% around the news. That kind of reaction explains why volatility readings remain elevated across every timeframe.
Hourly Momentum Complicates the Bullish Case
The hourly chart tells a starkly different story. Momentum indicators lean clearly bearish, and price is trading below key short-term moving averages. On the 1-hour chart, price at $6.70 sits below both the EMA20 at $7.13 and the EMA50 at $7.24. It remains above the EMA200 at $6.64. That is a mixed structure in itself, but the momentum signals leave little room for ambiguity.
RSI14 on the hourly sits at 36.34, approaching oversold territory. It signals active selling pressure rather than consolidation. The hourly MACD confirms that weakness. With the line at -0.25 against a signal of -0.14, the histogram reads -0.11 — a clean bearish reading. In contrast to the daily chart’s near-neutral MACD, the hourly setup shows momentum actively rolling over.
This is the core conflict in the current setup. The daily chart suggests exhaustion of the selloff. The hourly chart suggests the selling is not finished yet. Hourly Bollinger Bands reflect that same pressure. The mid-band at $7.30 sits well above current price, while the lower band at $6.29 is not far below. Meanwhile, the hourly ATR14 of $0.28 is proportionally large relative to price. Intraday swings remain sharp even as the daily range compresses relative to recent extremes.
15-Minute Execution Context
On the 15-minute chart, price is pinned near its pivot point, with tentative buying interest emerging beneath declining moving averages. Price is essentially glued to its pivot at $6.67, with resistance at $6.76 and support at $6.61.
The 15m RSI14 at 48.25 is neutral. Notably, the MACD histogram has flipped slightly positive at 0.05, despite the line at -0.14 still sitting below the signal at -0.19. That is an early, tentative sign of short-term buying interest. However, it is happening beneath the 15m EMA50 at $6.96 and the EMA200 at $7.24. Both still cap price from above. Therefore, any short-term bounce remains contained within a larger bearish structure until those levels are reclaimed.
Bullish Scenario for Lucid Stock
For a sustainable bullish reversal, Lucid stock must first hold daily support and reclaim the pivot. Only then can a challenge of the EMA20 begin. Specifically, bulls need price to hold above the $6.17 support and reclaim the daily pivot at $6.71 with conviction.
From there, a push back above the daily EMA20 at $6.94 would be an important step. Ideally, this would be accompanied by the hourly RSI recovering above 40. The hourly MACD histogram would also need to turn positive. If that alignment occurs, daily resistance at $7.23 becomes the next logical target. The Bollinger mid-band at $6.76 and upper band at $8.62 mark the broader range bulls would aim to reclaim over time.
Bearish Scenario and Invalidation
The bearish case draws its strength from the dominant long-term downtrend. A break below support would open a path toward significantly lower levels. A rejection at the daily pivot, followed by a break below $6.17 support, would invalidate any stabilization thesis.
That scenario would be reinforced if the hourly RSI stays pinned below 40. It would also gain strength if the hourly MACD histogram continues to widen negatively. The daily EMA200 sits at $10.24, far above current price, giving the structural downtrend plenty of room to reassert itself. A breakdown below support would open a path toward the daily Bollinger lower band near $4.90. The lowered production guidance for Q3 and Q4 adds fundamental weight to that risk. The widened earnings loss disclosed on the call reinforces the concern.
Closing Take
Overall, Lucid stock currently presents a genuine timeframe conflict that argues against high-conviction positioning. The daily chart shows a market attempting to stabilize near its moving averages. The hourly chart shows momentum still leaning to the downside.
Meanwhile, elevated ATR readings across both timeframes confirm volatility is not fading. Management’s operational reset and cash-flow targets are still being digested by the market. The CEO’s denial of take-private discussions removes one source of speculative noise. However, it does not resolve the deeper technical tension. Until price commits clearly to one side of the pivot structure, positioning carries elevated uncertainty. Traders should treat any short-term bounce or breakdown with the volatility backdrop firmly in mind.
FAQ
What is the current trend for Lucid stock?
The primary trend remains structurally bearish, with price trading more than 34% below the daily EMA200 at $10.24. The daily chart shows tentative stabilization near the EMA50, but the hourly chart continues to flash bearish momentum signals. No trend reversal has been confirmed.
What are the key support and resistance levels for LCID?
Key support sits at $6.17, with the daily Bollinger lower band at $4.90 marking the next major downside level. Resistance stands at the daily pivot of $6.71, followed by the EMA20 at $6.94 and then $7.23. The EMA200 at $10.24 represents the long-term structural resistance.
Why is Lucid stock so volatile right now?
The volatility stems from a Q2 2026 earnings-driven selloff following CEO Silvio Napoli’s operational reset announcement. The stock dropped as much as 13.88% on the news. The daily ATR14 of $0.90 confirms that single-session swings of a dollar or more remain realistic while the market digests the new guidance and cash-flow targets.
Is Lucid stock a buy at current levels?
The technical picture does not offer a clear entry signal in either direction. The daily chart suggests selling exhaustion, but the hourly chart shows momentum still rolling over. Elevated ATR readings and conflicting timeframe signals argue for caution rather than high-conviction positioning.
Disclaimer: This article is for informational purposes only and does not constitute financial advice, an investment recommendation, or a solicitation to buy or sell any financial instrument or cryptocurrency. The analysis provided is not indicative of future results. Investing in crypto assets and financial markets carries a high risk of capital loss. Always do your own research (DYOR) and consult a qualified financial advisor before making any decision.
Article produced with the assistance of artificial intelligence and reviewed by the editorial team.
