




Robinhood stock closed at $92.80 on August 5, fading from a $95.55 session high. After a 45% surge off the 52-week low, momentum is cooling. With price now below all three major moving averages, the question is whether Robinhood stock can extend higher or needs a reset.
Summary
Key takeaways
- Robinhood stock fell to $92.80 on August 5, closing below its EMA20, EMA50, and EMA200.
- Daily RSI14 sits at 44.33, below the 50 midline, while MACD shows a widening bearish gap.
- After rallying 45% from its 52-week low, Robinhood posted $1.31 billion in Q2 revenue and $0.62 EPS, beating estimates.
- The hourly chart shows fragile stabilization near $92.80, conflicting with the broader daily bearish bias.
- Robinhood trades at a 42.9x forward P/E, a valuation concern despite 51.6% revenue expansion.
Daily Chart: Structure Turns Cautious Below the Moving Averages
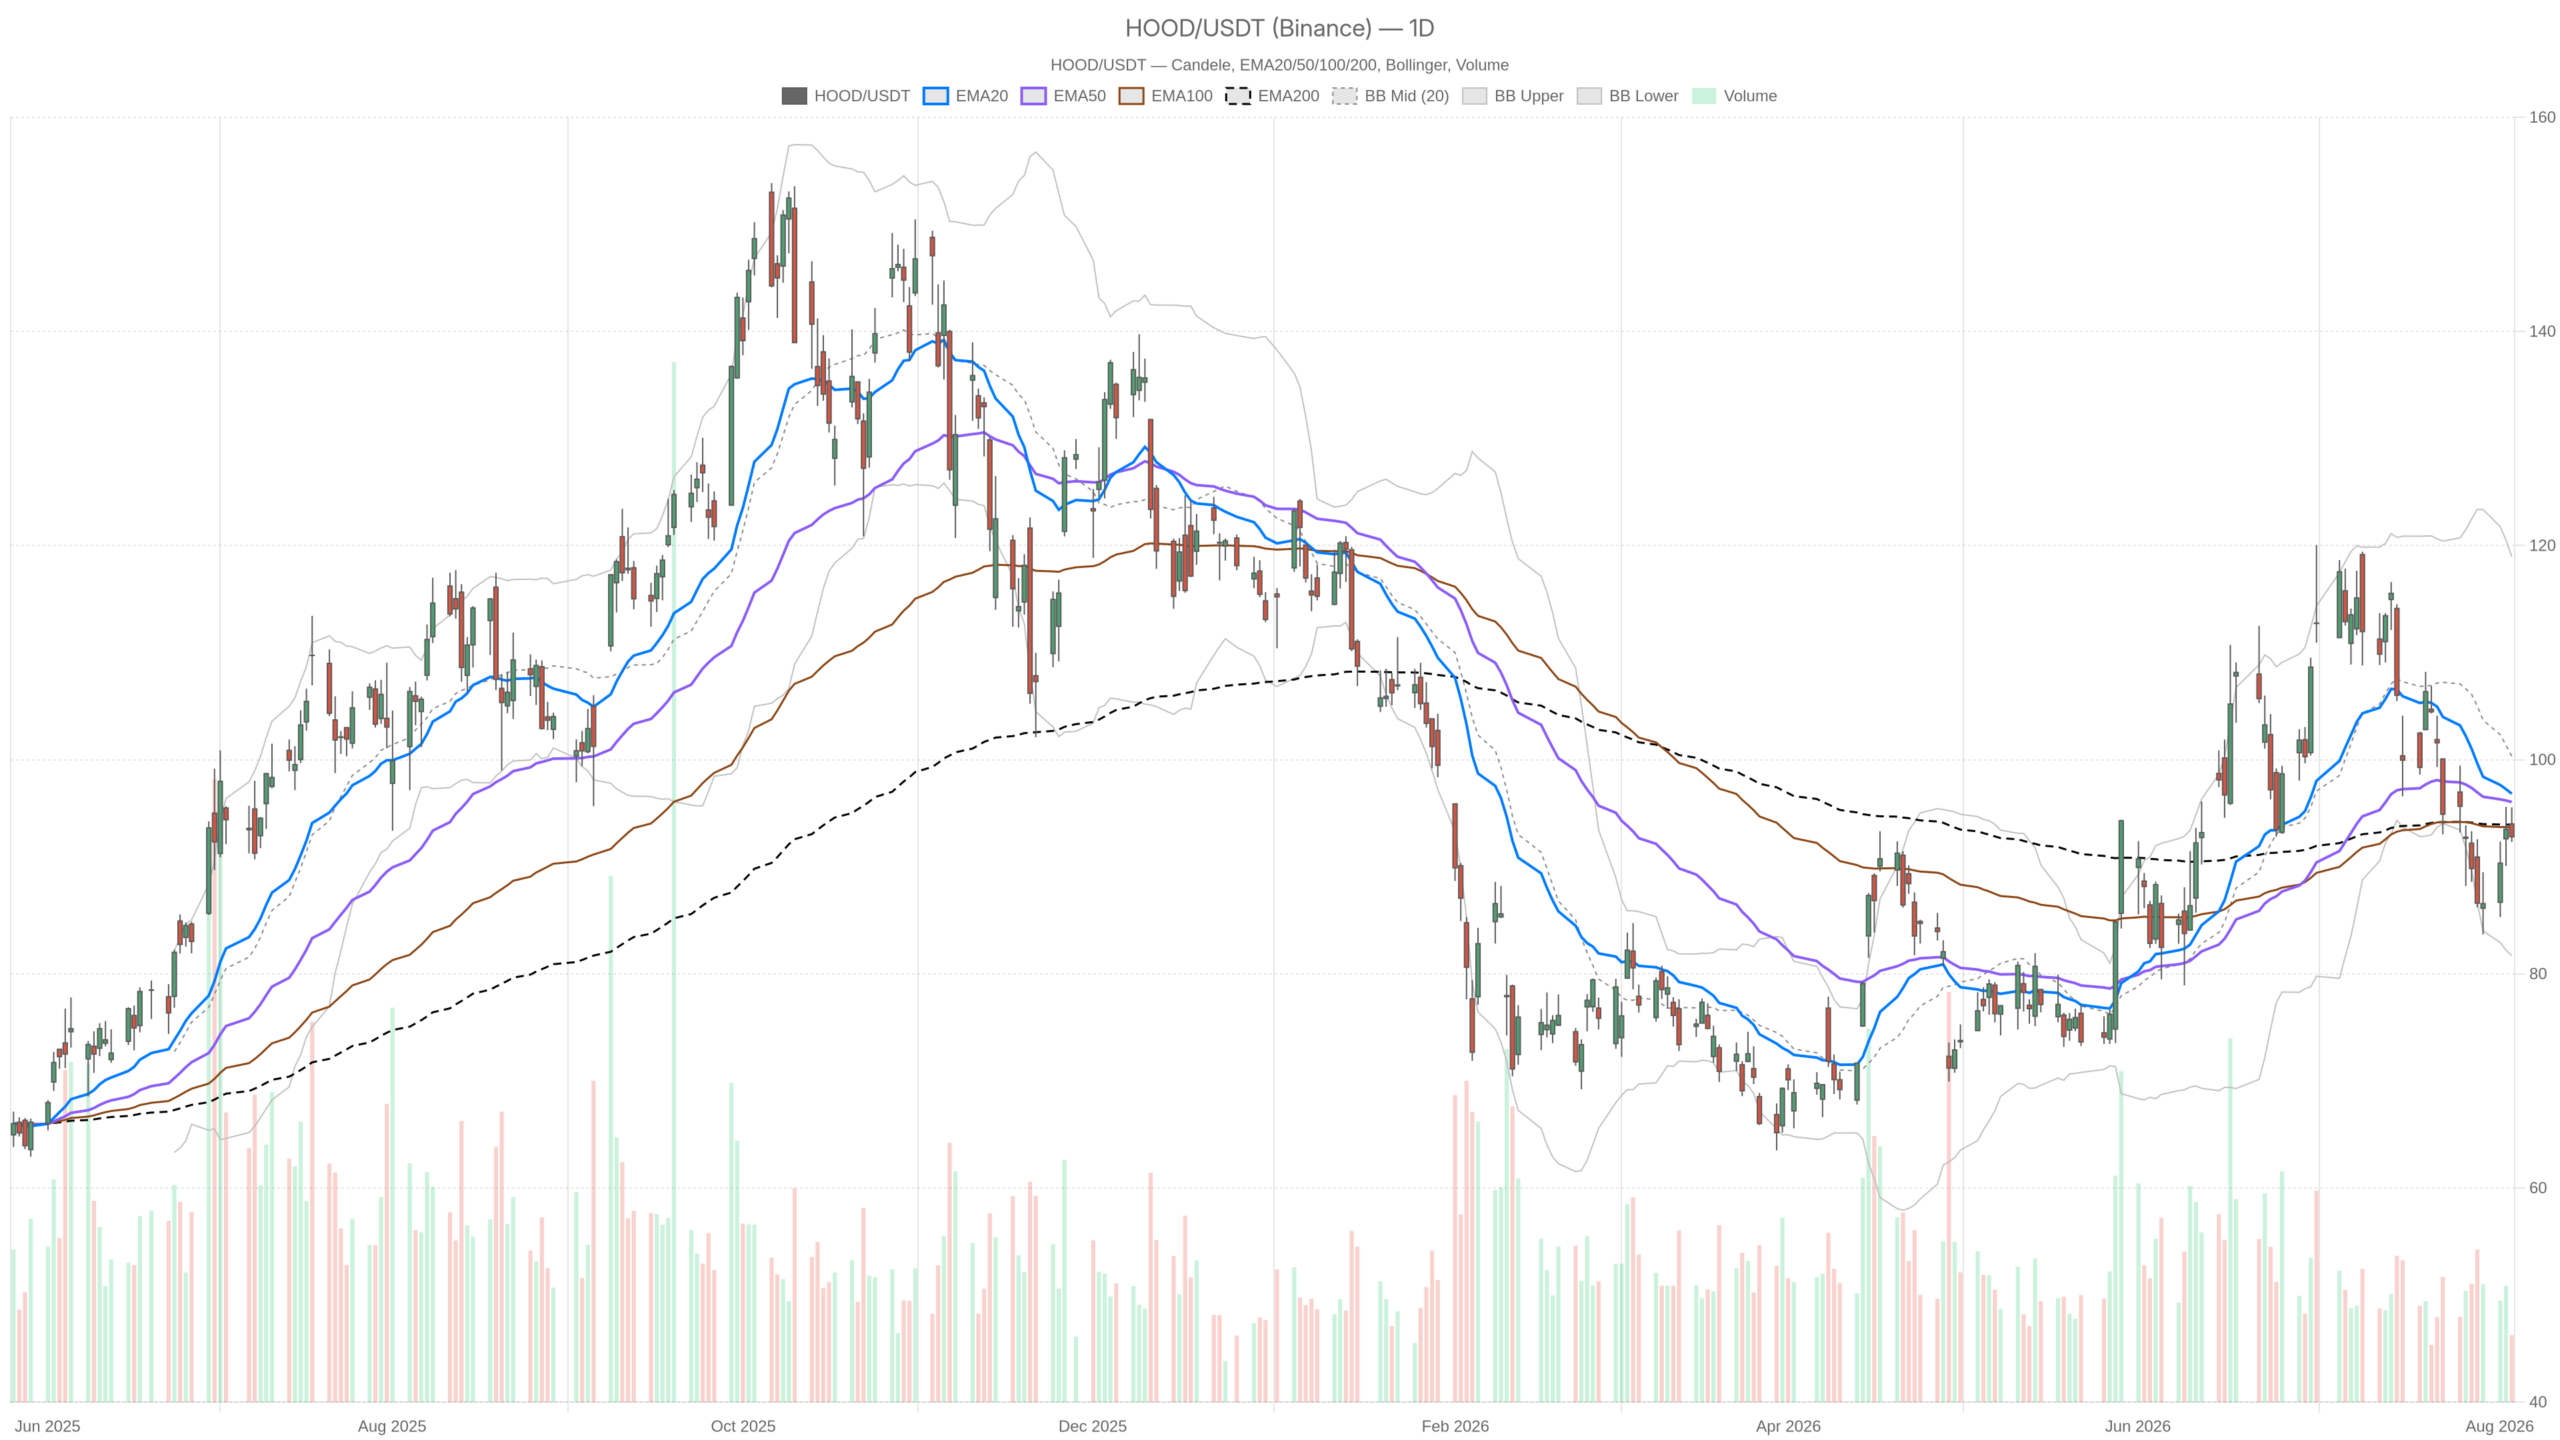
The daily chart for Robinhood stock leans neutral-to-bearish. Price closed at $92.80, sitting below the EMA20 at $96.82, the EMA50 at $96.06, and the EMA200 at $93.94. When price trades under all three major moving averages, it signals the recent uptrend has lost its grip. However, the EMAs themselves remain stacked in a bullish order from the earlier rally.
Momentum and Volatility Flash Caution
Momentum confirms the cooling tone. RSI14 sits at 44.33, below the 50 midline, pointing to fading buying pressure rather than outright capitulation. Meanwhile, MACD is more telling: the line is at -3, the signal at -1.52, and the histogram at -1.49. That is a bearish configuration, and the gap between line and signal is widening. In practical terms, sellers have been gradually gaining control since the recent top.
Volatility is also elevated. ATR14 stands at 6.07, wide by recent standards. The Bollinger Bands show a mid-line at $100.33. The upper band sits at $118.97 and the lower band at $81.69. Price is nowhere near either extreme. There is still plenty of room to move before the bands become a constraint. The daily pivot at $93.56, with resistance at $94.79 and support at $91.56, frames the near-term battlefield. Price closing below the pivot, closer to support, reinforces the defensive tone.
Hourly Timeframe: A Fragile Stabilization
The hourly chart for Robinhood stock complicates the daily narrative. Price at $92.80 sits almost exactly on the EMA20 at $92.63 and EMA50 at $92.71. That tight cluster signals indecision rather than conviction. Meanwhile, the hourly EMA200 sits far above at $98.08, a reminder that the broader hourly trend structure remains scarred by the recent decline.
Short-Term Bounce Meets Broader Resistance
RSI14 on the hourly chart reads 52.28, just above neutral. MACD shows a line of 1.01 against a signal of 0.93, with a thin histogram of 0.08. Those are marginally bullish readings, but they are not decisive. This is where the conflict with the daily bias becomes clear: the hourly chart hints at stabilization and a possible short-term bounce. The daily chart, however, still leans defensive. The bigger trend has softened, but the shorter-term tape is not yet confirming further downside.
The hourly pivot at $93.36, with resistance at $93.98 and support at $92.19, shows price trapped between the pivot and support. A reclaim of $93.36 would be an early sign that buyers are stepping back in on this timeframe.
15-Minute Execution: Oversold But Extended
On the 15-minute chart, Robinhood stock presents a more clearly bearish picture, useful mainly for timing rather than directional calls. Price at $92.80 trades below the EMA20 ($93.87), EMA50 ($93.23), and EMA200 ($92.93). That is a fully bearish alignment on this granular timeframe. RSI14 has dropped to 39.9, and MACD shows a negative histogram of -0.13, consistent with continued short-term selling pressure.
Notably, price has slipped below the lower Bollinger Band at $93.11. The mid-line sits at $93.96 and the upper band at $94.80. Such conditions often precede at least a temporary bounce back toward the mid-line, even within a larger corrective phase. The 15-minute pivot at $93.21, resistance at $93.66, and support at $92.34 give traders the immediate levels to watch. A break below $92.34 would likely accelerate the short-term slide. In contrast, a reclaim of $93.21 would suggest intraday sellers are losing steam.
The Bullish Case for Robinhood Stock
There is a constructive argument still on the table for Robinhood stock. The company posted second-quarter results with $1.31 billion in revenue and $0.62 in earnings per share, beating Wall Street estimates. The stock recovered part of its July losses after that report.
What Needs to Happen for Bulls to Regain Control
Additionally, Robinhood recently broke a four-day losing streak on news that it is launching the Robinhood Ventures Fund II. This gives retail investors access to private company investments through an upcoming NYSE listing. For the bullish scenario to build real traction, price needs to reclaim the daily pivot at $93.56. It must also hold above the EMA20/EMA50 cluster on the hourly chart. A push through $94.79 — the daily R1 — would help. If RSI14 also moves back above 50 on the daily timeframe, the technical tone would improve meaningfully.
The Bearish Case for Robinhood Stock
On the other hand, the bearish case has real substance behind it. One widely read piece argues that Robinhood stock’s main growth drivers may not be sustainable after the 45% rally from the 52-week low. That points to another possible sell-off.
Invalidation Points and Valuation Headwinds
Valuation is also a recurring concern. Robinhood’s 51.6% revenue expansion comes with a 42.9x forward P/E. This is a stark contrast to steadier peers like American Express, which trades on 8.4% revenue growth and a 13.5% net margin. Technically, the invalidation point for the bullish case is straightforward. A daily close below the EMA200 at $93.94 that fails to recover would be the first warning. Combined with a break of the daily S1 at $91.56, it would confirm the broader corrective structure is taking hold. If the 15-minute S1 at $92.34 also gives way without a bounce, sellers would gain near-term confirmation that they remain in control.
Closing Thoughts
Overall, Robinhood stock sits at a genuine crossroads. The daily chart has cooled from its recent highs, momentum has turned defensive, and volatility remains elevated with an ATR14 of 6.07. At the same time, the hourly chart shows a fragile stabilization that has not yet been invalidated. The 15-minute chart flags an oversold, extended move that could produce a short-term bounce. Given the conflicting signals across timeframes and the mix of a solid earnings beat against persistent valuation concerns, this is a market that calls for careful positioning. Close attention to the key pivot levels matters more than conviction in either direction.
FAQ
Is Robinhood stock bullish or bearish right now?
The daily chart leans neutral-to-bearish. Price closed at $92.80, below the EMA20 ($96.82), EMA50 ($96.06), and EMA200 ($93.94). RSI14 at 44.33 and a widening MACD bearish gap confirm fading momentum.
What are the key levels to watch for Robinhood stock?
Key levels include the daily pivot at $93.56, resistance at $94.79, and support at $91.56. On the hourly chart, watch $93.36. The 15-minute support at $92.34 is critical for near-term direction.
Did Robinhood stock beat earnings estimates?
Yes. Robinhood posted $1.31 billion in revenue and $0.62 in earnings per share for Q2, beating Wall Street estimates. The stock recovered part of its July losses after the report.
What is the valuation concern for Robinhood stock?
Robinhood trades at a 42.9x forward P/E despite 51.6% revenue expansion. This contrasts sharply with steadier peers like American Express. That company trades on 8.4% revenue growth and a 13.5% net margin.
Disclaimer: This article is for informational purposes only and does not constitute financial advice, an investment recommendation, or a solicitation to buy or sell any financial instrument or cryptocurrency. The analysis provided is not indicative of future results. Investing in crypto assets and financial markets carries a high risk of capital loss. Always do your own research (DYOR) and consult a qualified financial advisor before making any decision.
Article produced with the assistance of artificial intelligence and reviewed by the editorial team.
