




SoundHound AI, Inc. stock closed Wednesday at $6.43, then surged 13% after-hours on record Q2 revenue of $61.9 million, up 45% year-over-year. The company also raised its full-year outlook. The mismatch between a neutral chart and bullish fundamentals defines the setup ahead.
Summary
Key takeaways
- SoundHound AI reported record Q2 revenue of $61.9 million, a 45% year-over-year increase, and raised its full-year outlook.
- SOUN stock jumped 13% in after-hours trading following the earnings release.
- Short interest on SOUN stock stands at 42%, among the highest on Wall Street.
- The daily chart remains neutral, with RSI14 at 49.24 and price well below the 200-day EMA at $8.74.
- Key resistance sits at $6.56 and $6.80–$6.81; support rests at $6.37 and $6.34.
SOUN Stock Daily Trend: Neutral Structure, Fading Downside Momentum
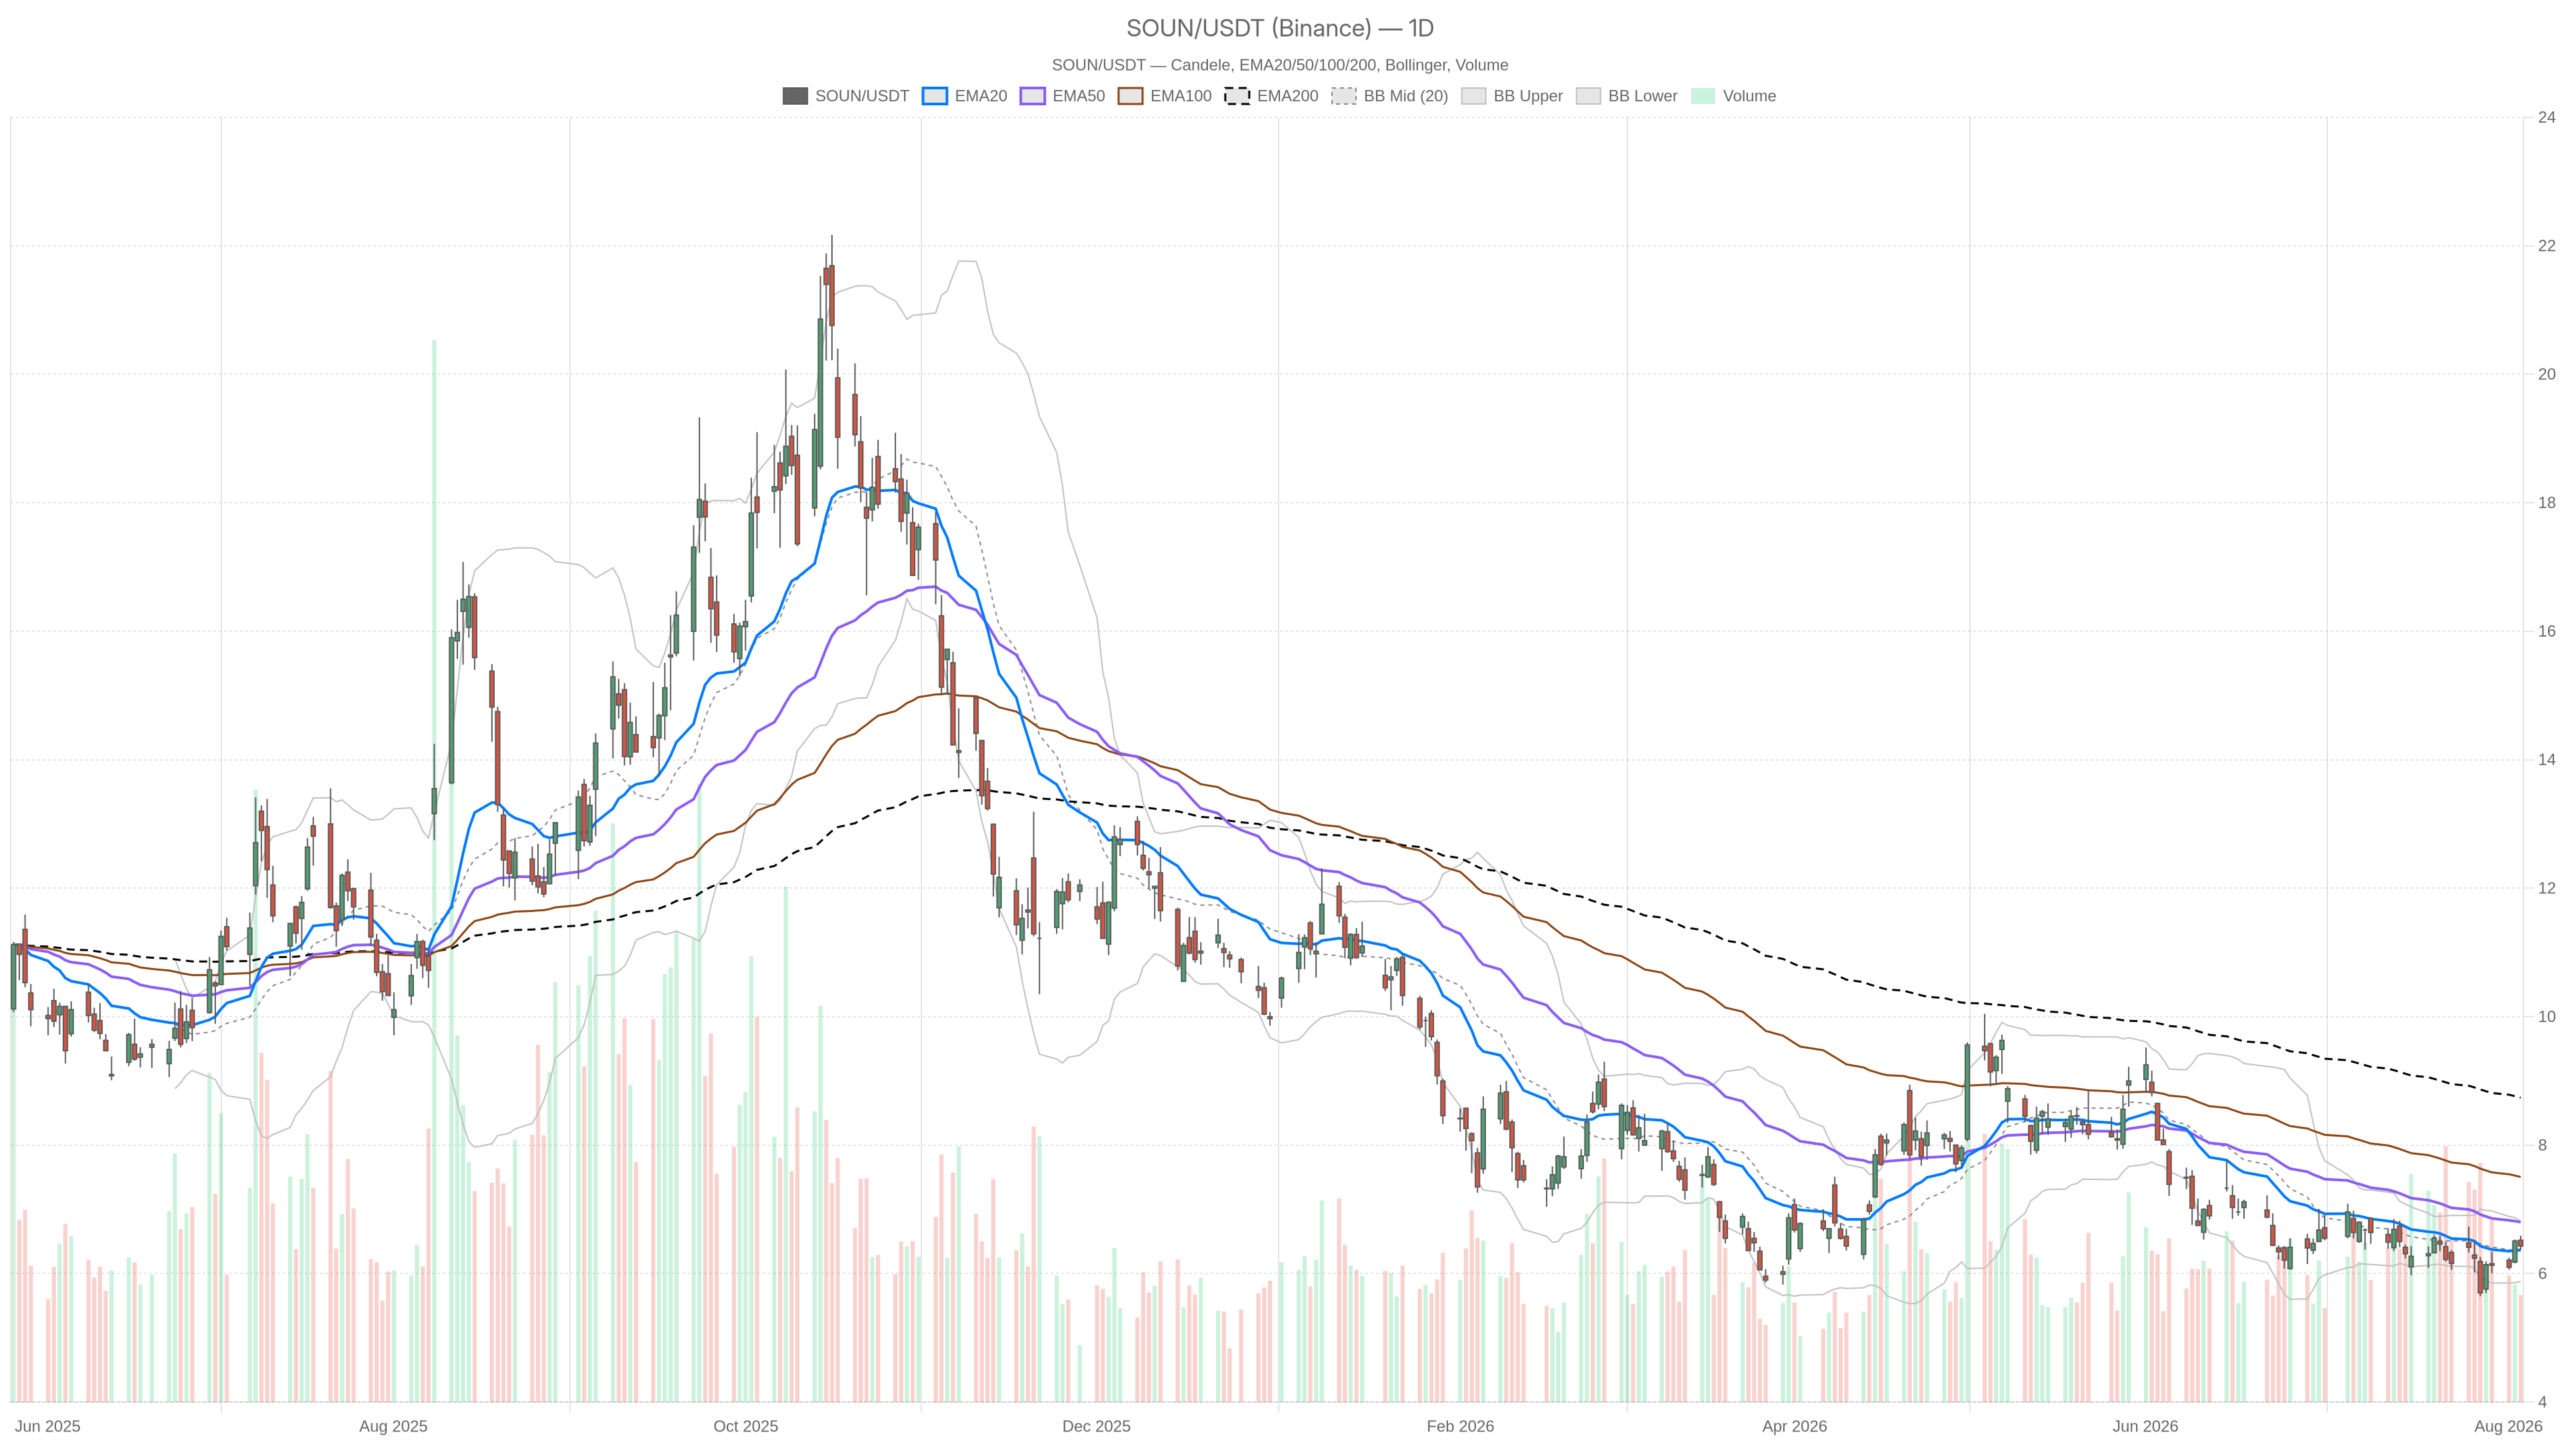
SOUN stock’s daily chart presents a neutral structure with fading downside momentum. Price hugs the 20-day EMA at $6.37 but trades well below the 50-day and 200-day EMAs, keeping the broader downtrend intact.
On the daily timeframe, the technical picture remains cautious rather than convincingly bearish. Price is trading right at the 20-day EMA of $6.37. However, it sits well below the 50-day EMA at $6.80 and dramatically below the 200-day EMA at $8.74. That wide gap to the long-term average confirms the broader downtrend that has weighed on the stock for months.
RSI14 at 49.24 sits almost exactly at the midpoint, offering no directional edge on its own. Meanwhile, MACD tells a more nuanced story. The line at -0.17 remains below the signal at -0.22, but the histogram has turned positive at 0.05. That combination suggests bearish momentum is fading, even if it hasn’t flipped to outright bullish yet. The daily regime reading is classified as neutral, reflecting a market caught between an aging downtrend and an unconfirmed recovery.
Bollinger Bands on the daily chart show price hugging the midline at 6.35, with the upper band at 6.81 and the lower band at 5.88. That positioning leaves room to move in either direction without immediately testing extremes. ATR14 at 0.38 confirms volatility is already elevated relative to the stock’s price level. This matters given the scale of the after-hours move.
Daily pivot support sits at 6.34, just below Wednesday’s close. Meanwhile, resistance at $6.56 marks the first hurdle for any recovery attempt.
1-Hour and 15-Minute Confirmation: Short-Term Strength Meets Resistance
The 1-hour chart confirms short-term strength but does not resolve the conflict with the daily downtrend. Price sits above short-term EMAs yet remains capped below the 200-hour EMA at $6.49.
Hourly Chart: Strength Stalls at Resistance
The 1-hour chart complicates the daily narrative rather than simply confirming it. Price closed at 6.42, above both the 20-hour EMA at 6.37 and the 50-hour EMA at 6.29. Still, it remains capped by the 200-hour EMA at 6.49. RSI14 at 57.98 leans bullish without being overbought, and it sits comfortably above the daily reading.
However, MACD on the hourly chart shows the line and signal essentially overlapping at 0.08, with the histogram flattening to zero. That flat histogram signals momentum has stalled just below the 200-hour average, precisely where sellers have stepped in before. In short, the 1-hour timeframe confirms short-term strength, but it does not resolve the larger conflict with the daily downtrend.
15-Minute Chart: Compression Precedes the Move
On the 15-minute chart, used here strictly for execution timing, the tone is more hesitant. Price at 6.42 sits just below its 20-period EMA of 6.44, while RSI14 has slipped to 44.78. MACD has turned marginally negative, with the line at -0.01 against a signal of 0.00. Bollinger Bands have compressed tightly, with the upper band at 6.49 and the lower band at 6.40, alongside a low ATR14 of 0.04. That kind of compression often precedes a sharper directional move. Given the pending earnings reaction, traders should expect volatility to expand quickly once the market fully digests the after-hours numbers.
Bullish Scenario for SoundHound AI, Inc. Stock
The bullish case for SoundHound AI, Inc. stock rests on record Q2 revenue of $61.9 million, raised full-year guidance, and extreme short interest of 42% that could fuel a short squeeze.
The bullish case here starts with the news, not the chart. SoundHound AI’s Q2 results beat estimates on both revenue and guidance. Quarterly revenue of $61.9 million marked an all-time high and a 45% year-over-year gain. Management also raised its full-year outlook, a signal that the growth trajectory is expected to extend beyond a single strong quarter.
Shares responded immediately, rising 13% in after-hours trading. The stock has also been flagged among heavily shorted names worth buying in separate market commentary.
For the bulls, the technical setup adds an extra layer of fuel. Short interest on SOUN stock currently stands at 42%, among the highest of any Wall Street name. That level of positioning means any sustained upside move risks triggering short covering. This can amplify gains well beyond what the fundamentals alone would justify.
If price clears the daily pivot resistance at $6.56 and pushes through the 50-day EMA at $6.80, the next technical target becomes the upper Bollinger Band at 6.81. A close above that zone would begin repairing the damage from the multi-month downtrend. It would open the door toward the 200-day EMA at $8.74, though that remains a distant target.
Bearish Scenario: What Would Invalidate the Rally
The bearish case turns on context rather than the earnings print itself. Wednesday’s pre-news rejection candle and stalling momentum at the 200-hour EMA raise the risk that the after-hours rally fails to hold.
The bearish counterargument leans heavily on context, not on the earnings print itself. Wednesday’s daily candle, formed before the news broke, showed SOUN opening at 6.52 and testing a high of 6.59. It then faded to close at 6.43. That kind of rejection candle, printed hours ahead of a bullish catalyst, illustrates how tentative buying interest had become.
On the 1-hour chart, momentum already stalled just under the 200-hour EMA at 6.49. The flattening MACD histogram there is a warning sign rather than a green light.
Should the after-hours gap fail to hold, price could slip back below the daily EMA20 at 6.37. The next level in focus would be the daily pivot support at 6.34. A break below that zone would put the stock back in the grip of the broader downtrend. It would effectively erase what would otherwise be an earnings-driven relief rally.
In that scenario, the 42% short interest cuts the other way too. It also reflects deep skepticism about SoundHound’s ability to sustain growth at current valuations.
Overall, SoundHound AI, Inc. stock is entering a high-volatility window where the fundamental story and the technical structure are pulling in different directions. The daily trend remains neutral-to-cautious, weighed down by a steep gap to the 200-day EMA. Meanwhile, the 1-hour chart shows tentative strength that has yet to be fully confirmed. The 15-minute compression suggests the market is coiling ahead of a decisive move once the earnings reaction is fully priced in.
ATR readings are elevated across both the daily and hourly timeframes. With short interest at an extreme 42%, price swings in either direction could be sharp. Given the conflicting signals across timeframes, this looks like a moment for disciplined risk management. The next session’s price action will likely determine whether the pre-earnings rejection candle or the earnings beat ends up defining the trend.
FAQ
What did SoundHound AI report for Q2 earnings?
SoundHound AI reported record Q2 revenue of $61.9 million, up 45% year-over-year, beating estimates. The company also raised its full-year revenue outlook.
How high is short interest on SOUN stock?
Short interest on SOUN stock stands at 42%, making it one of the most heavily shorted names on Wall Street. This level of positioning raises the potential for a short squeeze if the stock sustains upward momentum.
What are the key technical levels to watch for SOUN stock?
Key resistance levels are $6.56 (daily pivot) and $6.80–$6.81 (50-day EMA and upper Bollinger Band). The 200-day EMA at $8.74 remains a distant recovery target. Support sits at $6.37 (20-day EMA) and $6.34 (daily pivot support).
Is SOUN stock still in a downtrend despite the earnings beat?
Yes. Price remains well below the 50-day EMA at $6.80 and dramatically below the 200-day EMA at $8.74. The daily chart is classified as neutral, with fading bearish momentum rather than a confirmed trend reversal.
Disclaimer: This article is for informational purposes only and does not constitute financial advice, an investment recommendation, or a solicitation to buy or sell any financial instrument or cryptocurrency. The analysis provided is not indicative of future results. Investing in crypto assets and financial markets carries a high risk of capital loss. Always do your own research (DYOR) and consult a qualified financial advisor before making any decision.
Article produced with the assistance of artificial intelligence and reviewed by the editorial team.
