




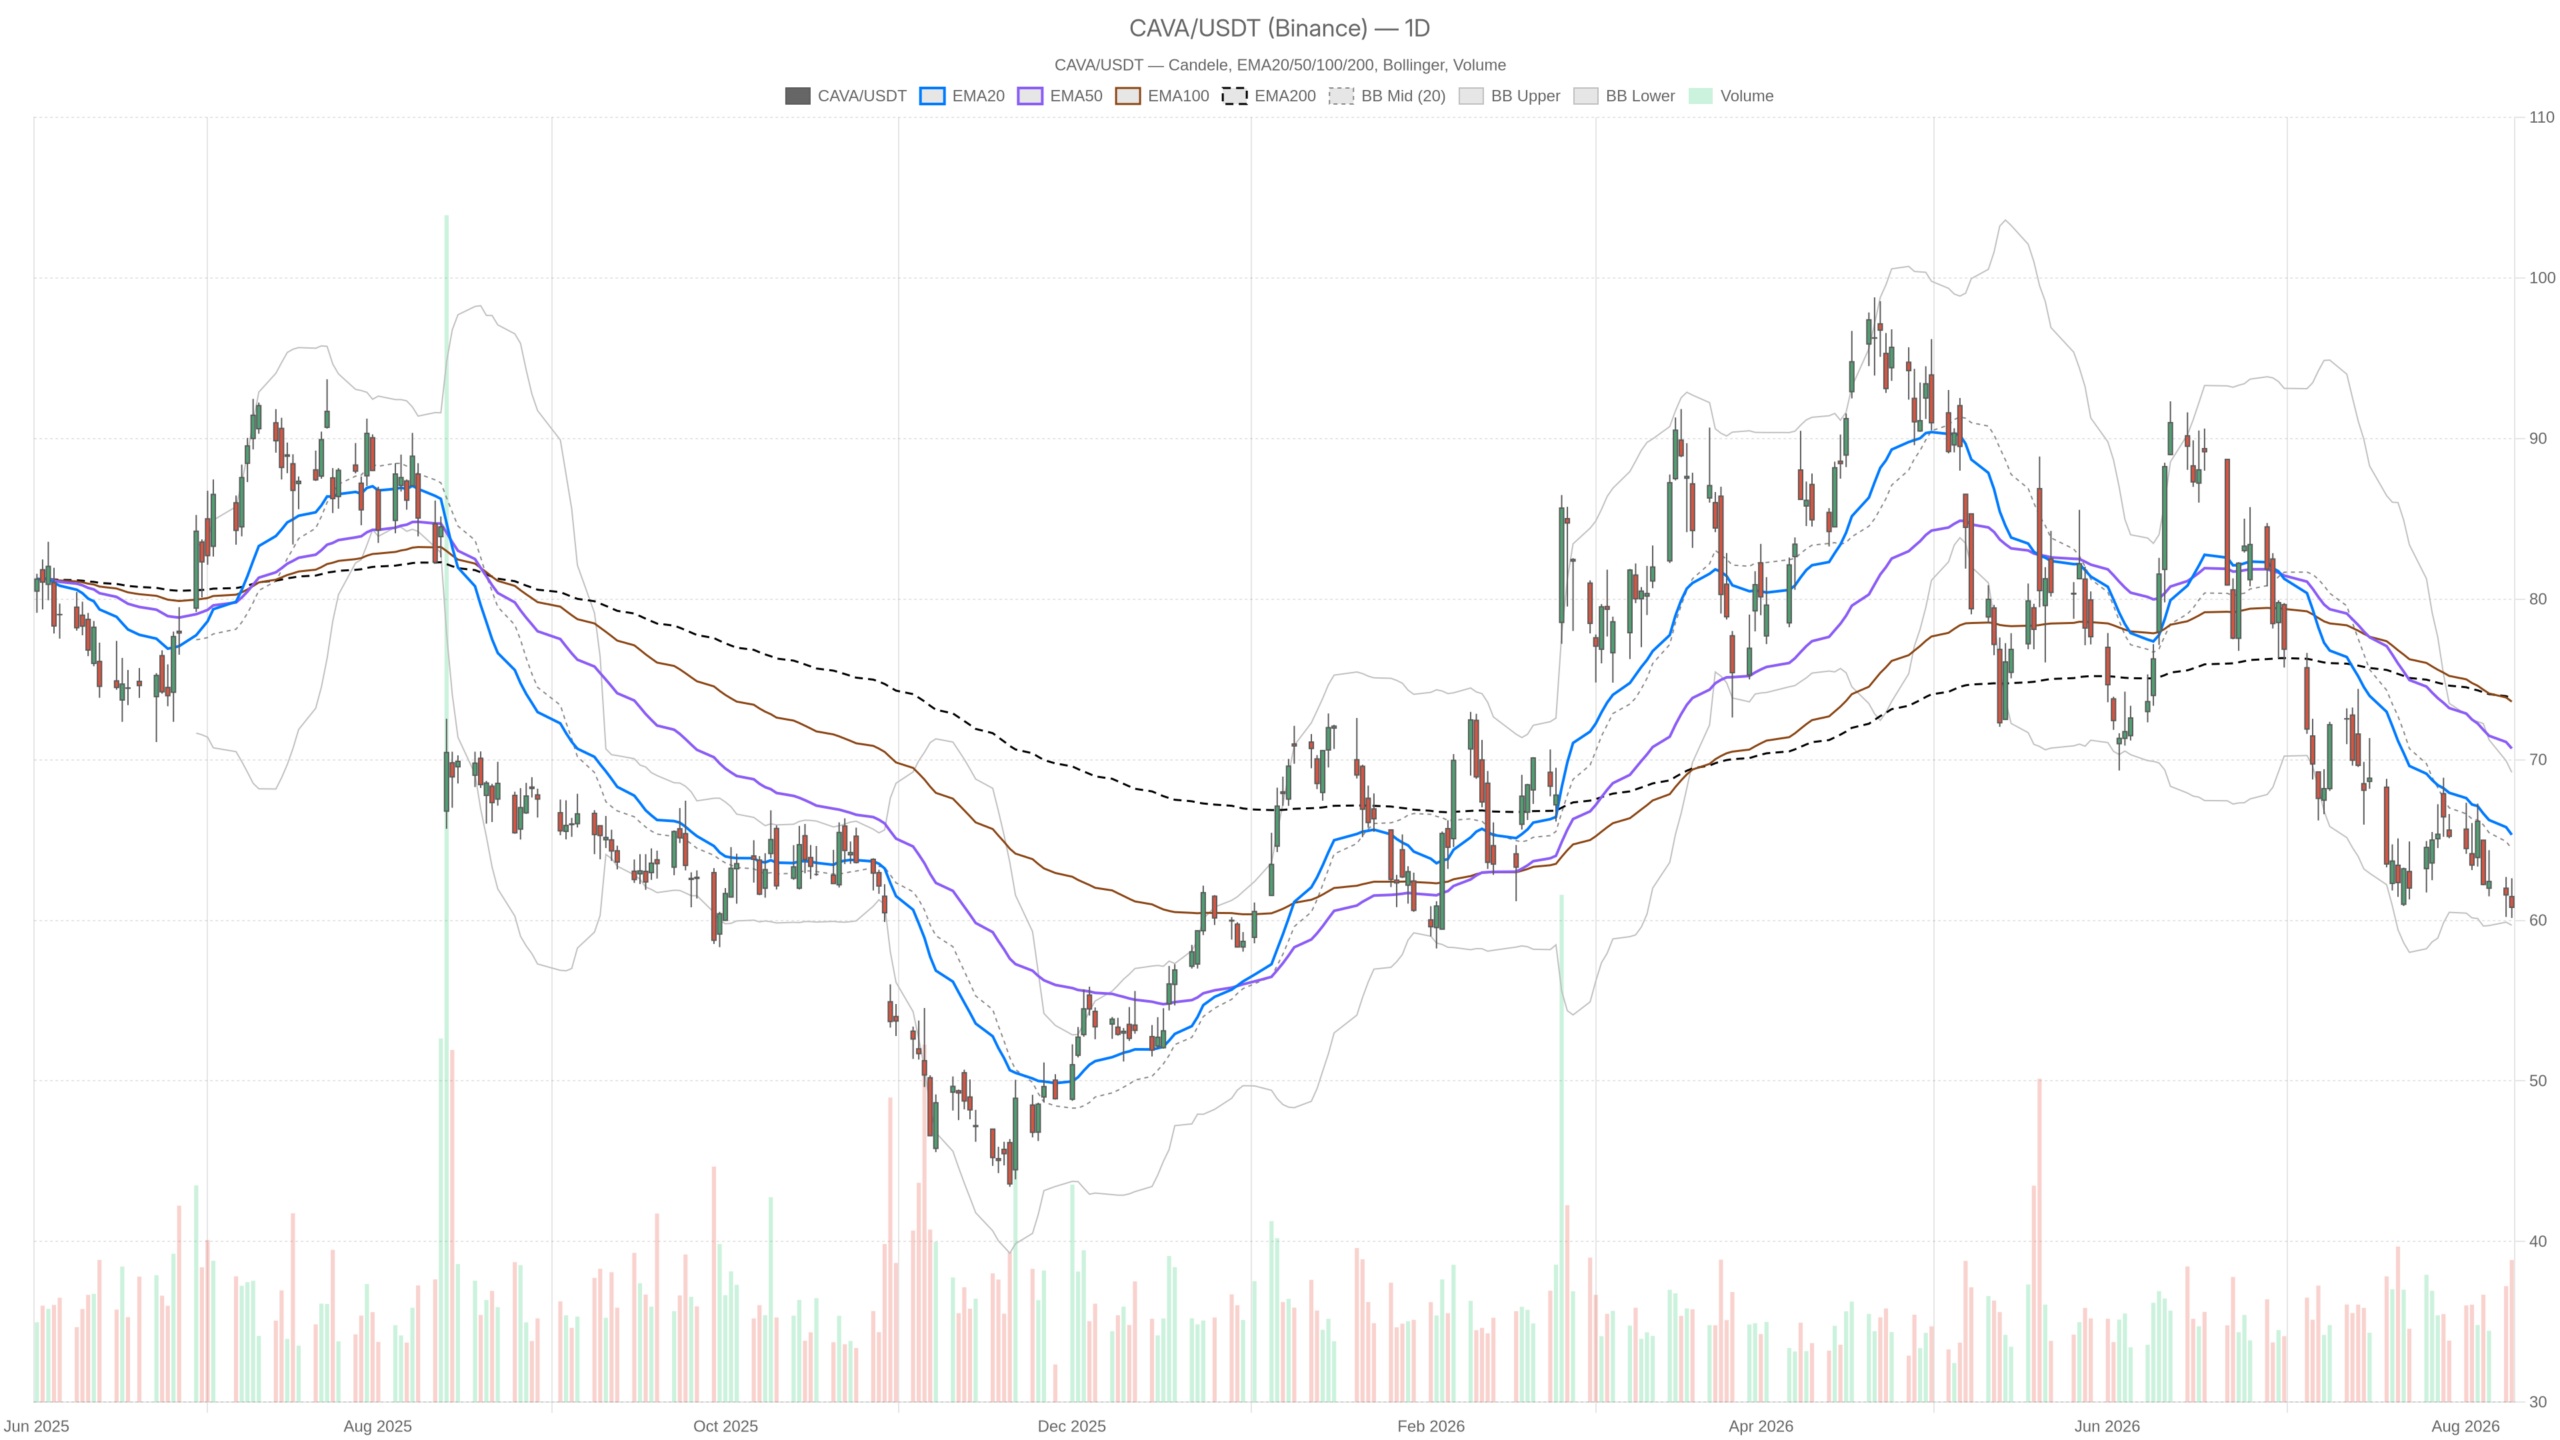
CAVA Group, Inc. stock closed at $60.81 on 11 August, pinned below every major moving average in a clear downtrend. After the bell, fiscal Q2 2026 results beat revenue expectations and shares jumped after hours. A technically broken chart now faces a fundamentally improved narrative.
Summary
Key takeaways
- CAVA Group, Inc. stock closed at $60.81, below the 20-day EMA at $65.33, the 50-day at $70.70, and the 200-day at $73.83.
- Daily RSI at 35.39 reflects persistent selling pressure without reaching capitulation.
- A fiscal Q2 2026 revenue beat ignited an after-hours rally, challenging the bearish technical structure.
- Support sits at $59.69–$59.77; a decisive break would confirm trend continuation.
- Bulls must reclaim $61.19–$62.24 on real volume to shift the market bias.
The Daily Chart Still Commands the Bearish Bias for CAVA Group, Inc. Stock
The daily chart remains firmly bearish. Price sits below all three major moving averages in textbook distribution. No reversal signal has yet confirmed. The honest starting point is that the trend structure remains bearish until proven otherwise. Price sits under the 20-day EMA at $65.33, the 50-day at $70.70, and the 200-day at $73.83. Short-term averages are below medium-term, which are below long-term. That is textbook distribution, and it took months of selling to build.
Momentum: Weakness Without Capitulation
Daily RSI at 35.39 tells a specific story. It is weak, but it is not washed out. Sellers remain in control of momentum. Yet the indicator has room to fall further before capitulation levels come into play. In other words, the tape has been heavy without reaching panic.
Meanwhile, the daily MACD hints at fatigue in the decline. The line sits at -3.00 against a signal at -3.16, producing a small positive histogram of +0.15. That is not a trend reversal. It is a deceleration signal, the kind that typically precedes either a base or a lower-high failure.
Volatility and Price Envelope
Notably, Bollinger Bands frame the risk cleanly. The lower band sits at $59.69, the midline at $64.45, and the upper band at $69.21. Price at $60.81 is hugging the lower rail. Sustained closes down there confirm trend strength rather than exhaustion. However, the distance back to the midline shows how much repair work a genuine recovery would require.
At the same time, volatility deserves respect. Daily ATR of $3.00 against a $60 share price translates to roughly a 5% average daily range. Therefore, any post-earnings gap can travel a long way before it looks statistically unusual. Position sizing built on quiet-market assumptions would be misplaced here.
Meanwhile, daily pivots give the immediate map: pivot at $61.19, resistance at $62.24, support at $59.77. The close came in just under the pivot. The session low of $60.15 held above support. Buyers defended, but they did not win the day.
The 1H Chart Confirms Weakness, With Early Cracks in the Selling
The hourly chart reinforces the bearish bias without challenging it. The trend structure remains intact, yet momentum is flattening rather than accelerating. The 1H close of $60.78 sits below the 20-period EMA at $61.81. It also sits below the 50 at $63.05 and the 200 at $67.61. The spread between short and long-term hourly averages is wide, typical of a market that has trended hard in one direction.
Hourly RSI at 37.14 mirrors the daily reading. There is no bullish divergence to lean on, just persistent softness. At the same time, the hourly MACD histogram has turned marginally positive at +0.02. The line sits at -0.78 versus a signal of -0.80. Momentum is flattening at the lows rather than accelerating downward.
Hourly Bollinger Bands sit between $59.85 and $63.78, with the midline at $61.81. Price is in the lower third of that channel. The last hourly candle ranged from $60.37 to $60.99 and closed near its high. That shows modest intraday absorption. Hourly ATR of $0.90 defines the realistic noise band for short-term work.
15-Minute Chart: Compression Ahead of the CAVA Earnings Move
The 15-minute chart reflects a compressed, undecided market. Short-term volatility has tightened ahead of a post-earnings repricing that will likely resolve violently. Price closed at $60.78, below the 20-period EMA at $61.02 and the 50 at $61.44. The 200 EMA sits far above at $63.11. RSI has recovered to 44.24, the strongest of the three timeframes. This reflects a short-term bounce inside a larger downtrend.
However, the 15-minute MACD histogram is negative at -0.06. The micro bounce lacks follow-through. Bands are tight, running from $60.28 to $62.02, and ATR is just $0.41. That tightness matters. Compressed short-term volatility ahead of a post-earnings repricing usually resolves violently in one direction.
Bullish Scenario for CAVA Group, Inc. Stock
The bullish case now has a genuine catalyst. A revenue beat has already lifted shares after hours, and sustained buying could break the downtrend structure. Q2 2026 revenue topped expectations. That is exactly the kind of event that can break a downtrend. Coverage before the print had also framed the stock as trading at a discount following the recent pullback. Technically, bulls need price to reclaim the daily pivot at $61.19. They must then clear $62.24 on real volume.
From there, the hourly 20 EMA at $61.81 and the hourly midline at the same level become the first genuine test. Above that, the 1H 50 EMA at $63.05 and the 15-minute 200 EMA at $63.11 cluster into a meaningful resistance shelf. A close back above the daily Bollinger midline at $64.45 would be the first evidence of a structural change rather than a relief rally.
Bearish Scenario for CAVA Group, Inc. Stock
On the other hand, the bearish case rests on the trend still being in force. A failed earnings pop would reinforce the existing downtrend and validate sceptical positioning. If the earnings pop fades and price slips back under $59.77, the daily support pivot gives way. The daily lower band at $59.69 sits right beneath it. A decisive break of that zone would open the door to trend continuation. At that point, 5% daily ranges become the working assumption.
Sentiment risk cuts the same way. Ahead of the print, Hedgeye added CAVA as a new short idea, citing weakening comps, lingering food-safety risk, and a rich valuation. That argument does not disappear because one quarter beat on revenue. Any failed rally that stalls beneath $62.24 and rolls over would validate the sceptics. It would also invalidate the bullish setup.
Positioning and Uncertainty
Taken together, the signals are genuinely mixed, and it is worth saying so plainly. Trend and moving-average structure remain bearish across all three timeframes. In contrast, momentum is decelerating on both the daily and hourly MACD. Meanwhile, the earnings beat delivers a fundamental jolt. The charts have not yet priced it in.
Overall, the levels to watch are narrow and well defined. Support at $59.69–$59.77 is the line that keeps the downtrend intact. Resistance at $61.19 through $62.24 is the gate bulls must force open. Until one of those breaks holds, CAVA Group, Inc. stock sits in a high-volatility situation. The technical trend and the latest headline are pulling in opposite directions.
FAQ
What is the current trend for CAVA Group, Inc. stock?
The daily trend is clearly bearish. Price closed at $60.81, below the 20-day EMA at $65.33, the 50-day at $70.70, and the 200-day at $73.83. This forms a textbook distribution structure that took months of selling to build.
What changed after CAVA’s fiscal Q2 2026 earnings?
CAVA reported fiscal Q2 2026 revenue that beat expectations, triggering an after-hours rally. This introduces a fundamental catalyst that challenges the prevailing bearish technical structure.
What are the key levels to watch for CAVA Group, Inc. stock?
Support sits at $59.69–$59.77; a break below would confirm trend continuation. Resistance at $61.19–$62.24 must be reclaimed on volume for bulls to shift the technical outlook. A close above $64.45 would signal structural change rather than a relief rally.
Why was CAVA stock under pressure before earnings?
Before the print, Hedgeye added CAVA as a short idea, citing weakening comps, lingering food-safety risk, and a rich valuation. Combined with the bearish moving-average structure, this kept the stock pinned near the lower Bollinger Band.
Disclaimer: This article is for informational purposes only and does not constitute financial advice, an investment recommendation, or a solicitation to buy or sell any financial instrument or cryptocurrency. The analysis provided is not indicative of future results. Investing in crypto assets and financial markets carries a high risk of capital loss. Always do your own research (DYOR) and consult a qualified financial advisor before making any decision.
Article produced with the assistance of artificial intelligence and reviewed by the editorial team.
