




AAPL stock sits at a crossroads. Apple closed the last session at $310.03, flat against the prior pivot, within a $305.74–$311.49 range. The daily chart has cooled, while the hourly chart builds a case for a short-term bounce.
Summary
Key takeaways
- Apple closed at $310.03, flat against the prior pivot, inside a $305.74–$311.49 range.
- The daily RSI reads 47.86, while the MACD histogram sits at -1.66, signaling fading momentum.
- The hourly RSI is 64.45 with a positive MACD histogram of 0.52, reflecting short-term buying interest.
- Resistance clusters between 311.72 and 312.43, just above the 20-day EMA at 311.97.
- The 200-day EMA at 281.56 keeps the longer-term uptrend intact.
Daily Chart: AAPL Stock Momentum Fades as Structure Holds
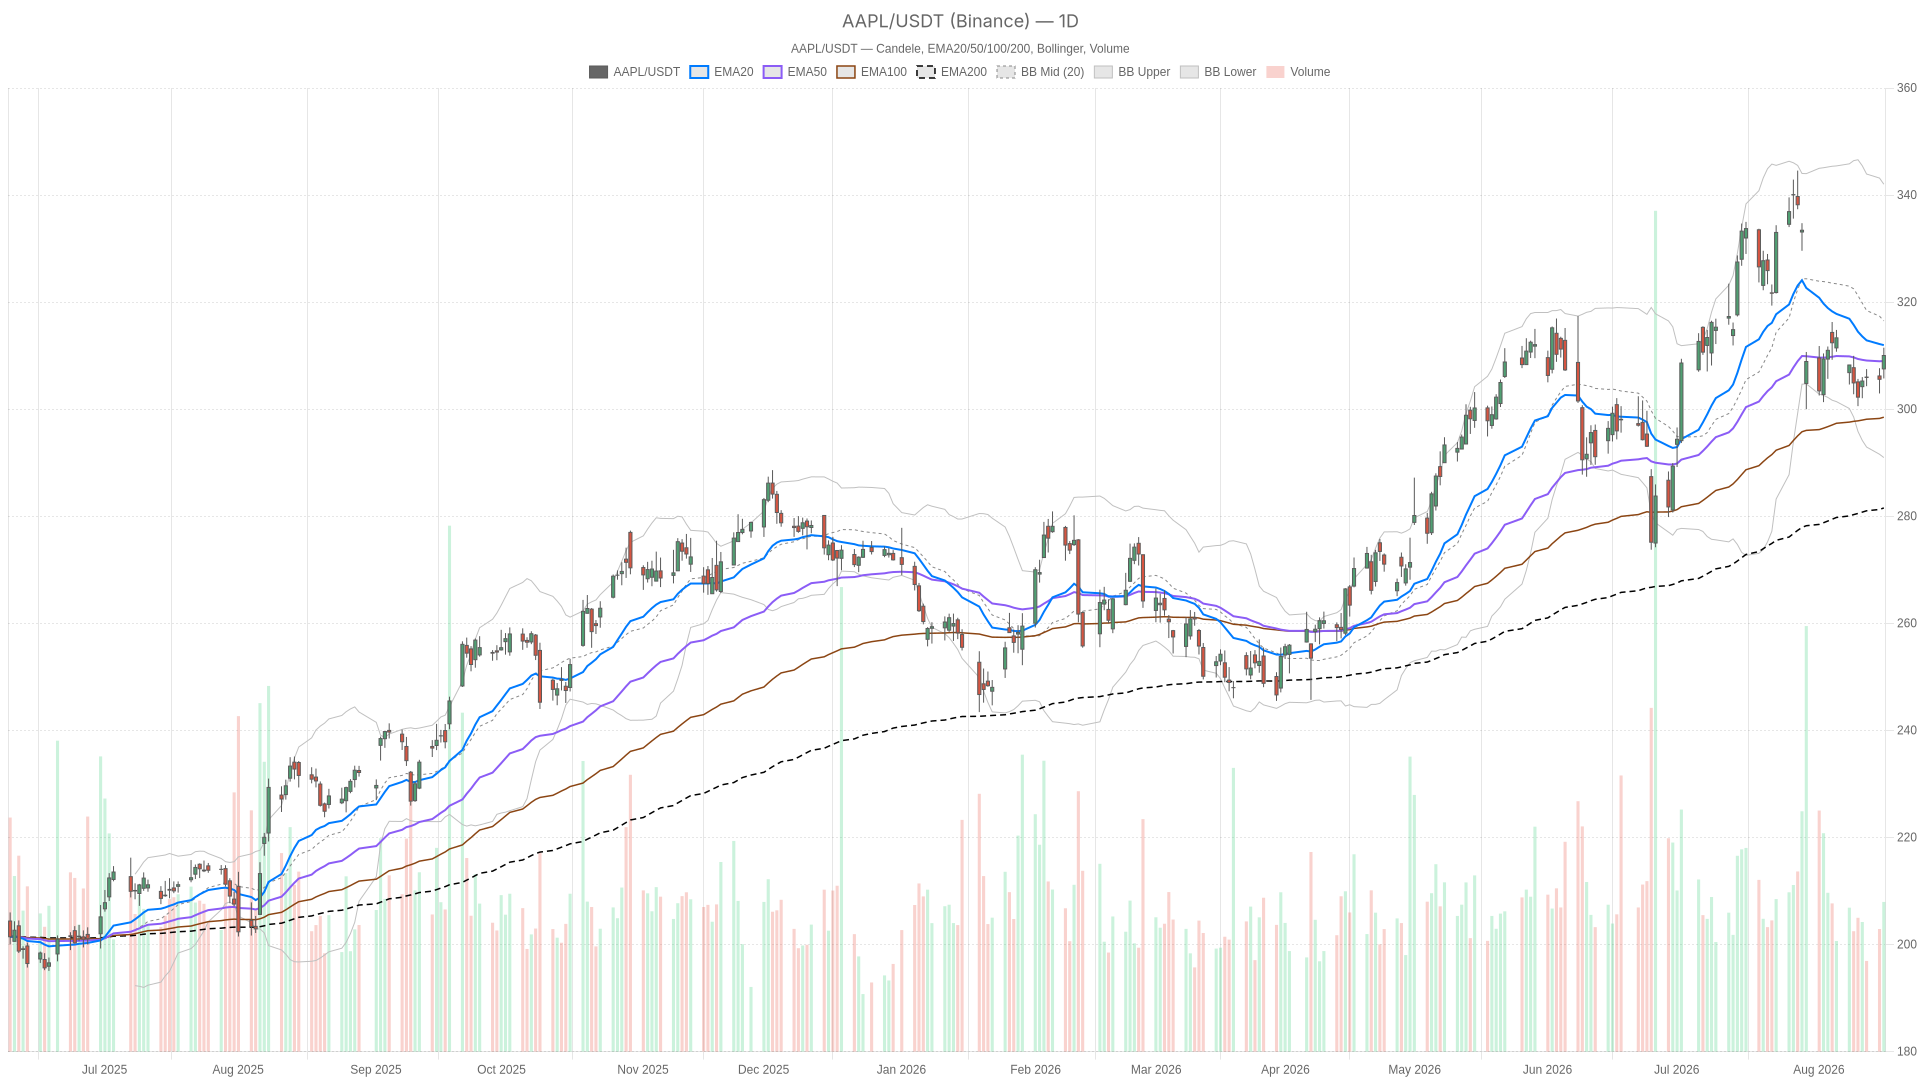
The daily chart shows a neutral-to-soft tone for AAPL stock even as its long-term structure remains intact. Price trades below the 20-day EMA at 311.97 but above the 50-day EMA at 309.00. That is a tight, undecided pocket between short-term resistance and support. The 200-day EMA at 281.56 sits far below, confirming the broader uptrend has not broken.
Daily Momentum Signals Turn Mixed
Daily momentum reads as neutral to slightly soft. The RSI sits at 47.86, essentially neutral, with the daily regime tag also classified as neutral. Meanwhile, the MACD paints a more bearish picture. The line sits at -2.46 against a signal of -0.80, producing a histogram of -1.66. That negative, widening histogram points to building downside momentum in recent sessions, even as the broader trend stays constructive.
Bollinger Bands and Pivot Context
Bollinger Bands add useful context. The mid-band sits at 316.49, with the upper band at 342.02 and the lower band at 290.97. Price sits well below the midline but nowhere near the lower band, so volatility has not extremed in either direction. A daily ATR of 8.31 confirms normal, digestible ranges rather than panic swings. On pivots, the daily point at 309.09 has essentially been reclaimed, with resistance at 312.43 and support at 306.68 defining the near-term battle lines.
Hourly Timeframe: A More Constructive Tone for Apple
The 1-hour chart leans bullish for Apple, even though price is pressing into resistance. Hourly RSI has climbed to 64.45, reflecting genuine buying interest rather than a stretched market. In contrast to the daily reading, the MACD line at 1.40 above its signal at 0.87 produces a positive histogram of 0.52. That is a clearly bullish hourly momentum signal.
Confluence at the 311–312.50 Zone
At the same time, price is bumping into a meaningful ceiling. The hourly 200-EMA sits at 311.72, just above the current close of 310.20, while the upper Bollinger band is at 311.94. Notably, both levels converge almost perfectly with the daily R1 pivot at 312.43. That confluence turns the 311–312.50 zone into the key decision point for AAPL stock in the sessions ahead. The hourly ATR of 1.77 suggests enough energy to test the zone. It may not be enough to clear it cleanly on the first attempt.
15-Minute Execution Context
The 15-minute chart is tagged outright bullish for the near term. Price trades above its 20, 50, and 200-period EMAs at 309.84, 308.25, and 306.64. RSI at 57.24 supports a mildly constructive tape. However, the MACD histogram has just flipped negative at -0.23, even though the line at 0.69 stays above zero. That is a subtle warning sign of fading short-term thrust as price sits between the 15-minute pivot at 310.41 and resistance at 310.86.
Bollinger Bands on this timeframe have tightened considerably, with the upper band at 311.06 and the lower band at 309.56. The ATR is just 0.65. This kind of compression typically precedes a directional move rather than defining one. For intraday positioning, the 309.74 support and 310.86 resistance are the levels to watch for a break in either direction.
The Bullish Case for AAPL Stock
The bullish case for AAPL stock depends on clearing the 311.72–312.43 resistance cluster with conviction. A daily close back above the 20-day EMA at 311.97 would materially improve the technical picture. If the daily MACD histogram narrows toward zero while hourly RSI holds above 60, hourly strength would finally translate into the higher timeframe. The next target would be the daily Bollinger mid-band near 316.49.
Fundamentally, the news backdrop offers some support. Apple shares reportedly jumped even as the Nasdaq sold off sharply. Reporting suggests a rotation inside the so-called Magnificent 7 as investors reassess AI-related risk. Meanwhile, coverage of BofA and Morgan Stanley notes both firms expect a foldable iPhone, disagreeing only on its magnitude of impact. That leaves room for the rally to extend if the catalyst plays out as the more bullish analysts expect.
The Bearish Case and the Invalidation Zone
On the other hand, the bearish case rests on the daily chart’s still-negative MACD and Apple’s failure to reclaim the 20-day EMA. If AAPL rejects the 311–312 zone again, a slide through the daily pivot at 309.09 toward support at 306.68 would follow. That would confirm the bounce was corrective rather than trend-changing. A close below the 50-day EMA at 309.00 would be an important tell that sellers have regained control.
News flow offers a counterweight here. One widely discussed piece frames Apple’s “anti-AI” positioning as having helped the stock earlier in the year. It has since flipped into a liability as sentiment shifted. Separately, another analysis suggests AAPL could trade around 21% above fair value on the strength of its premium iPhone and AI push. That comes even as the company opened an Advanced Manufacturing Center in Houston to expand domestic capacity for Mac mini and AI servers. If valuation concerns dominate again, the 311–312 resistance zone could prove difficult to overcome.
Closing Take
Overall, AAPL stock is caught between a cooled daily chart and a bullish hourly push toward resistance. The long-term trend, anchored by a 200-day EMA far below current price, remains constructive. Therefore, this looks less like a market picking a clear direction and more like one testing a well-defined resistance shelf before the next move.
Volatility readings across all three timeframes remain contained rather than extreme, which suggests the market is coiling rather than trending decisively. Given the mixed momentum signals and diverging analyst views, positioning calls for patience and close attention to whether the 311–312 zone finally breaks or continues to hold.
FAQ
What is the key resistance level for AAPL stock right now?
The key resistance sits between 311.72 and 312.43, where the hourly 200-EMA, the upper Bollinger band, and the daily R1 pivot converge.
Is Apple’s long-term uptrend still intact?
Yes. Price remains far above the 200-day EMA at 281.56, which confirms the longer-term uptrend has not been broken.
What would invalidate the bullish case?
A rejection of the 311–312 zone would shift control to sellers. A break of the daily pivot at 309.09 and the 50-day EMA at 309.00 would confirm it, with support at 306.68.
What are analysts expecting from Apple?
Coverage of BofA and Morgan Stanley notes both firms expect a foldable iPhone, disagreeing only on its magnitude of impact.
Disclaimer: This article is for informational purposes only and does not constitute financial advice, an investment recommendation, or a solicitation to buy or sell any financial instrument or cryptocurrency. The analysis provided is not indicative of future results. Investing in crypto assets and financial markets carries a high risk of capital loss. Always do your own research (DYOR) and consult a qualified financial advisor before making any decision.
Article produced with the assistance of artificial intelligence and reviewed by the editorial team.
